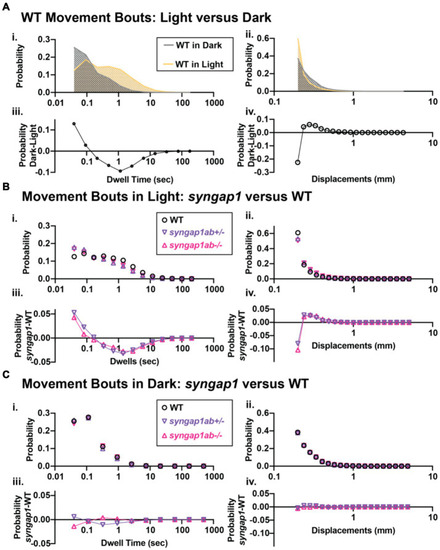
Syngap1ab mutants showed heightened arousal during lights-on cycles with more frequent and larger displacements. (Ai,ii) Probability distributions of dwell times (Ai) and displacements (Aii) are plotted for all 173 WT(syngap1ab+/+) larvae during lights-on (yellow) and lights-off (dark; checkered) cycles. Below (Aiii,iv) compare movements in dark and light by plotting probability in dark minus the probability in light. WT larvae moved farther more frequently in dark than in light. (B,C) Probability distributions of dwell time (Bi, Ci) and displacements (Bii, Cii) are plotted for all 173 WT, 167 syngap1ab+/− and 119 syngap1ab+/− mutant larvae. Below probability distribution plots (Biii,iv, Ciii,iv) compare movements in syngap1ab+/− (purple) and syngap1ab−/− (pink) to WT (black) by plotting probability in syngap1ab mutants minus the probability in WT. In dark, syngpa1ab+/− larvae moved more frequently than either WT or syngap1ab−/− larvae while all genotypes had similar displacement distributions. By contrast, in light, both syngpa1ab+/− and syngap1ab−/− larvae moved more frequently and farther than WT following a similar pattern that WT larvae showed during dark periods. p values were calculated using two-sample Kolmogorov–Smirnov test and for lights-on displacement: p(WT vs. syngap1ab+/−) = 0, p(WT vs. syngap1ab−/−) = 0, and p(syngap1ab+/− vs. syngap1ab−/−) = p < 10−70 and during lights-off displacement; p(WT vs. syngap1ab+/−) = 10−26, p(WT vs. syngap1ab−/−) = 1.5×10⁻¹¹, and p(syngap1ab+/− vs. syngap1ab−/−) = p < 10−45, lights-on dwell time (WT vs. syngap1ab+/−) = 0, p(WT vs. syngap1ab−/−) = 0, and p(syngap1ab+/− vs. syngap1ab−/−) = p < 10−31 and lights-off dwell time; p(WT vs. syngap1ab+/−) = 10−200, p(WT vs. syngap1ab−/−) = 10−50, and p(syngap1ab+/− vs. syngap1ab−/−) = p < 10−200.
|
