
- Title
-
Epidermal growth factor-like domain 7 drives brain lymphatic endothelial cell development through integrin αvβ3
- Authors
- Chen, J., Ding, J., Li, Y., Feng, F., Xu, Y., Wang, T., He, J., Cang, J., Luo, L.
- Source
- Full text @ Nat. Commun.
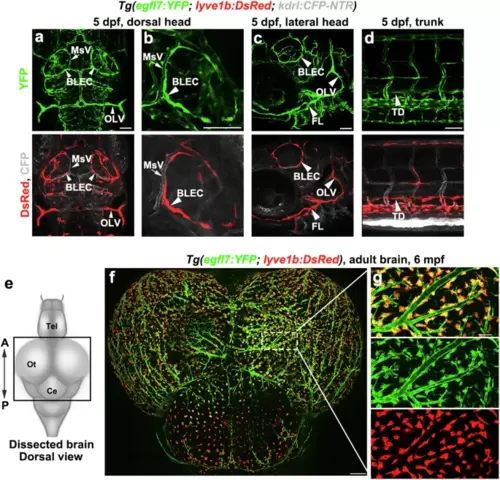
Tg(egfl7:YFP) transgenic zebrafish express YFP in blood vessels and lymphatics.a–d Tg(egfl7:YFP) was generated showing YFP in blood vessels and lymphatics. The distribution of YFP is similar with CFP and DsRed in the triple transgenic line Tg(egfl7:YFP; lyve1b: DsRed; kdrl: CFP-NTR) at 5 dpf. n = 25/25 embryos. The low-magnified image shows the dorsal view of the head (a), the high-magnified image in another embryo shows the magnified BLECs loop in the dorsal brain (b). The lateral facial lymphatics of the head shows in c. The trunk lymphatics shows in d. BLECs, brain lymphatic endothelial cells, MsV, mesencephalic vein, OLV, otolithic lymphatic vessel, FL, facial lymphatics, TD, thoracic duct. Scale bar, 50 μm. e Schematic diagram showing the dorsal view of a dissected adult zebrafish brain. f egfl7 promoter-driven YFP is expressed in all BLECs and blood vessels. n = 6/8 adults. g High-magnification inset showing the YFP overlap with DsRed in the double transgenic line Tg(egfl7:YFP; lyve1b: DsRed). Scale bars, 200 μm in f and 50 μm in g. |
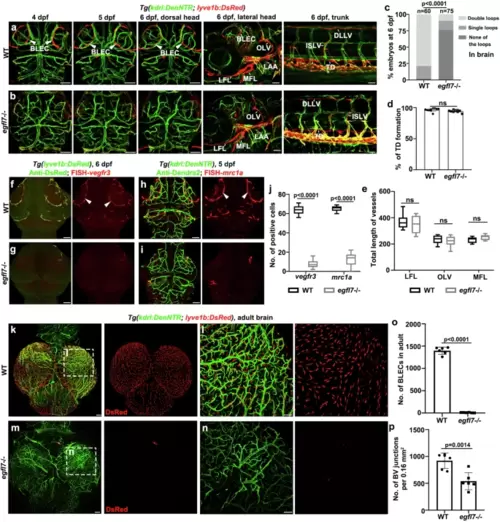
egfl7 is essential for zebrafish BLEC formation.a Confocal images of the BLECs, facial lymphatics, and trunk lymphatics in Tg(kdrl: DenNTR;lyve1b: DsRed) transgenic lines from 4 dpf to 6 dpf in WT. b Loss of egfl7 prevents the formation of the BLECs from 4 dpf to 6 dpf, but the facial lymphatics of the lateral head and trunk lymphatics are normal in egfl7 mutant embryos at 6 dpf. c Percentage of embryos that have double lymphatic loops, single loops, and none of the loops in the brain (WT, n = 60 embryos, egfl7-/-, n = 75 embryos, χ2 test). d The statistics show the percentage of TD formation per 6 somites (n = 10 embryos, two-tailed unpaired t-test; ns, no significance. Data are represented as mean ± SD). e The statistics show the total lengths of LFLs, OLVs, and MFLs at 6 dpf (n = 8 embryos, 2way ANOVA multiple comparisons test; ns, no significance. Box plots show the five-number summary of a set of data: including the minimum score (shown at the end of the lower whisker), first (lower) quartile, median, third (upper) quartile, and maximum score (shown at the end of the upper whisker)). BLECs, brain lymphatic endothelial cells; LFL lateral facial lymphatic, MFL medial facial lymphatic, LAA lymphatic branchial arches, OLV otolithic lymphatic vessel, ISLV intersegmental lymphatic vessels, DLLV dorsal longitudinal lymphatic vessel, TD thoracic duct. f, g Double labeling of FISH-vegfr3 and anti-DsRed in Tg(lyve1b:DsRed) transgenic background at 6 dpf. Arrowheads point to the BLECs in the top layer of the brain. h, i Double labeling of FISH-mrc1a and anti-Dendra2 in Tg(kdrl:DenNTR) transgenic background at 5 dpf. j The statistics show the number of vegfr3+ and mrc1a + BLECs in WT and egfl7 mutant (n = 9 embryos, 2-way ANOVA multiple comparisons test. Box plots show the five-number summary of a set of data: including the minimum score (shown at the end of the lower whisker), first (lower) quartile, median, third (upper) quartile, and maximum score (shown at the end of the upper whisker). k–n Dissection and whole-mount images of BLECs and meningeal vascular in Tg(kdrl: DenNTR;lyve1b: DsRed) adult brain at 6 mpf (months post-fertilization) in WT (k, l) and egfl7 mutant (m, n). o, p The statistics show the number of lyve1b + BLECs in the adult brain (o, n = 6 brains; two-tailed unpaired t test) and the number of BV junctions per 0.16 mm2 of a brain (p, n = 6 brain areas; two-tailed unpaired t test). Data are represented as mean ± SD. Scale bar, 50 μm. |
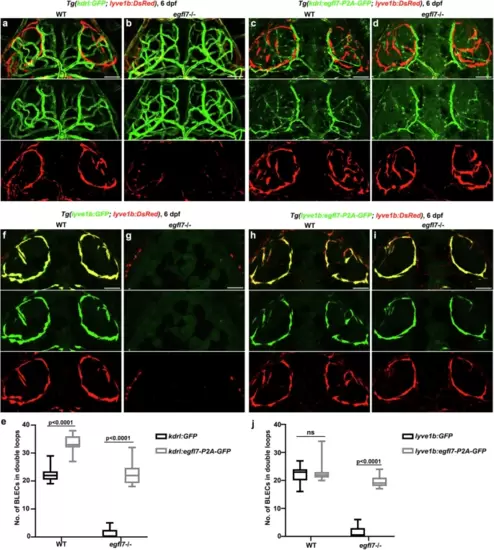
egfl7 regulates brain lymphatics development either autonomously or non-autonomously.a–d In the stable transgenic line Tg(kdrl:egfl7-p2A-GFP), the replenishment of Egfl7 in BVs can rescue the absence of BLECs in the egfl7 mutant (d) in contrast to the mutant under the Tg(kdrl: GFP) transgenic line (b). For WT, overexpression of Egfl7 in the BVs results in increased BLECs emerge in the bilateral loop over the brain (c) compared to the WT under the Tg(kdrl:GFP) (a). e The statistics show the number of BLECs per double loops in WT and egfl7 mutant under Tg(kdrl: GFP) and Tg(kdrl:egfl7-p2A-GFP) transgenic lines (n = 24 embryos, 2-way ANOVA. Box plots show the five-number summary of a set of data: including the minimum score (shown at the end of the lower whisker), first (lower) quartile, median, third (upper) quartile, and maximum score (shown at the end of the upper whisker)). f–i In contrast to the mutant under Tg(lyve1b: GFP) transgenic line (g), the replenishment of Egfl7 in LECs under Tg(lyve1b:egfl7-p2A-GFP) is able to re-form the BLECs bilateral loop in the egfl7 mutant (i). And overexpression of Egfl7 in WT lymphatics shows the BLECs are unaltered (f, h). j The statistics show the number of BLECs per double loops in WT and egfl7 mutant under Tg(lyve1b: GFP) and Tg(lyve1b:egfl7-p2A-GFP) transgenic lines (n = 24 embryos, 2-way ANOVA. Box plots show the five-number summary of a set of data: including the minimum score (shown at the end of the lower whisker), first (lower) quartile, median, third (upper) quartile, and maximum score (shown at the end of the upper whisker)). Scale bar, 50 μm. |
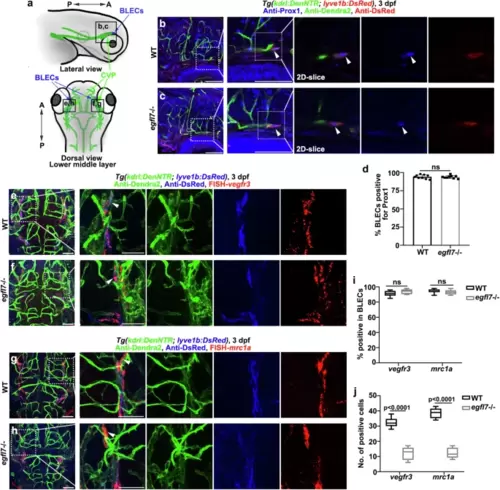
egfl7 is not required for the specification of BLECs progenitors sprout from CVP.a Schematic diagram showing the lateral view and the lower middle layer of the brain, respectively. Black frames indicate the image area of corresponding panels. CVP, choroidal vascular plexus. b, c Immunofluorescence staining for blood endothelial cells (Anti-Dendra2), BLECs (Anti-DsRed), and Anti-Prox1 (blue nuclei) in the WT (b) and egfl7 mutant (c) at 3 dpf. Arrowheads of the magnified 2D single slice image point to the Prox1+ BLECs progenitors sprout from CVP. d The statistics show the ratio of BLECs progenitors positive for Prox1 in WT and egfl7 mutant (n = 9 embryos; two-tailed unpaired t test; ns, no significance. Data are represented as mean ± SD). e–h Confocal image showing the triple labeling of FISH-vegfr3 or FISH-mrc1a, anti-DsRed, and Dendra2 in Tg(kdrl:DenNTR; lyve1b:DsRed) transgenic background in WT (e, g) and egfl7 mutant (f, h). Arrowheads in the magnified image shows vegfr3 mRNA and mrc1a mRNA are expressed in the lyve1b positive and low-level kdrl expressing BLECs progenitors departing the CVP. i The statistics show the ratio of BLECs positive for vegfr3 and mrc1a in WT and egfl7 mutant (n = 8 embryos; 2way ANOVA multiple comparisons test; ns, no significance. Box plots show the five-number summary of a set of data: including the minimum score (shown at the end of the lower whisker), first (lower) quartile, median, third (upper) quartile, and maximum score (shown at the end of the upper whisker)). j The statistics show the number of vegfr3+ and mrc1a + BLECs in WT and egfl7 mutant (n = 8 embryos; 2way ANOVA multiple comparisons test. Box plots show the five-number summary of a set of data: including the minimum score (shown at the end of the lower whisker), first (lower) quartile, median, third (upper) quartile, and maximum score (shown at the end of the upper whisker)). Scale bar, 50 μm. |
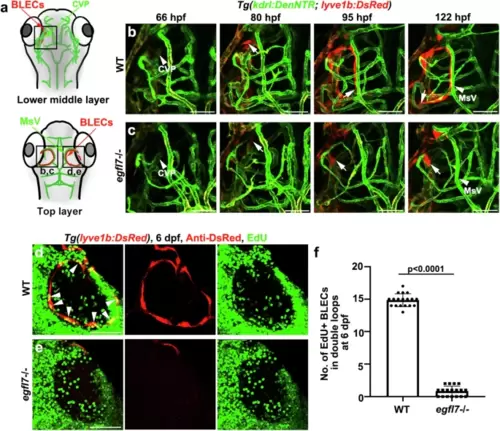
egfl7 is essential for the migration and proliferation of BLECs.a Schematic diagram showing the lower middle layer and top layer of the vessels in the brain, respectively. Black frames indicate the image area of corresponding panels. CVP (choroidal vascular plexus) is observed in the lower middle layer; MsV (mesencephalic vein) is in the top layer. b Time-lapse image of Tg(lyve1b: DsRed; kdrl: DenNTR) from 66 hpf to 122 hpf show the BLECs (arrows) sprout from CVP (arrowhead at 66 hpf) and migrate along the MsV (arrowhead) to form the lymphatic loop in WT at 122 hpf. n = 15 embryos. c The BLECs (arrows) of egfl7 mutant shows a delayed sprouting from CVP (arrowhead at 66 hpf), fail to migrate along the MsV (arrowhead), and is unable to form the loop at 122 hpf. n = 15 embryos. d–f EdU staining shows the proliferation of BLECs in WT and egfl7 mutant at 6 dpf, the EdU is injected at 56 hpf. Note the EdU+ BLECs is significantly decreased in the mutant (d, e). Arrowheads indicate the EdU+ BLECs in WT. The statistics show the number of EdU+ BLECs in double loops at 6 dpf in WT and egfl7 mutant (f, n = 18 embryos; two-tailed unpaired t-test). Data are represented as mean ± SD. Scale bar, 50 μm. |
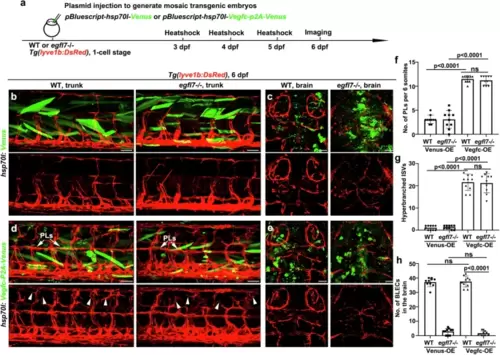
Vegfc overexpression fails to rescue the devoid of BLECs caused by egfl7 mutation.a Schematic diagram showing the experimental design for detecting the development of LECs after the ectopic, mosaic expression of Vegfc and Venus. Illustrations of the method, transgenic lines, plasmids, and time points of heat shock, and imaging. b, d Compared to the heatshock of Venus, overexpression of Vegfc, causing a hyperbranching in adjacent PLs (arrows) and hyperbranched ISVs in the horizontal myoseptum (arrowheads) of WT (b) and egfl7 mutant (d). f, g The statistics shows the number of PLs per 6 somites (f) and the number of hyperbranched ISVs (g) after ectopic expression of Vegfc and Venus in the trunk (n = 10 embryos; two-tailed unpaired t-test). c, e Compared to the heatshock of Venus, overexpression of Vegfc in the brain does not rescue the devoid of BLECs in the egfl7 mutant. h Quantification of the number of BLECs in the brain after ectopic expression of Vegfc and Venus in the brain (n = 10 embryos; two-tailed unpaired t-test). Data are represented as mean ± SD. Scale bar, 50 μm. |
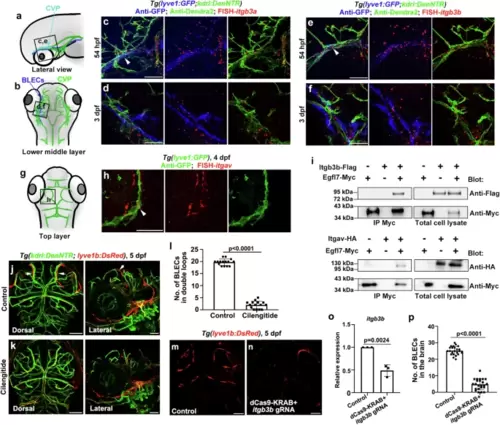
Egfl7 interacts with integrin αvβ3 to regulate BLECs formation. a, b, g Schematic diagram showing the lateral view, the lower middle layer, and the top layer of the vessels in the dorsal view, respectively. Black frames indicate the orientation and the image area of corresponding panels. c–f In Tg(lyve1b: GFP; kdrl: DenNTR) transgenic background, FISH and antibody staining show itgb3a and itgb3b are expressed in CVPs at 54 hpf (c, n = 20/21 embryos, e n = 20/20 embryos, arrowheads), and expressed in BVs and departed BLECs at 3 dpf (d, n = 20/20 embryos, f, n = 19/20 embryos). h Double labeling of FISH-itgav and anti-GFP in Tg(lyve1b: GFP) transgenic background at 4 dpf, arrowheads points the itgav expressed in BLECs. n = 15/16 embryos. i HEK293T cells were transfected with Egfl7-Myc and Itgb3b-Flag or Itgav-HA. Egfl7 was immunoprecipitated using anti-Myc antibody and the immunoprecipitants were analyzed for the presence of Itgav-HA or Itgb3b-Flag by Western blot. j–l Inhibition of integrin αvβ3 by Cilengitide treatment from 54 hpf to 5 dpf phenocopy the devoid of the lymphatic loop in the brain (k). Arrows point to the BLECs in the control group (j). The statistics show the number of BLECs in the double loops after Cilengitide treatment (l, n = 15 embryos; two-tailed unpaired t-test. Data are represented as mean ± SD). m–p The itgb3b transcript elongation inhibition causes BLECs reduction in the brain. Dorsal view of BLECs loop-like structure of uninjected siblings and samples co-injected with dCas9-KRAB mRNA and itgb3b gRNAs (m, n). The co-injection of gRNA and CRISPRi results in decreased expression of itgb3b and the number of BLECs (o, n = 3 replicants; p, n = 23 embryos; two-tailed unpaired t-test. Data are represented as mean ± SD). Scale bar, 50 μm. |
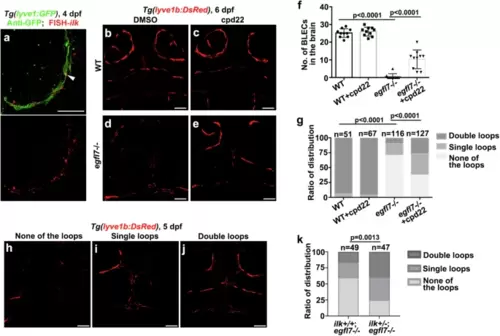
Egfl7-Integrin αvβ3 plays a role in BLECs formation through ILK pathway.a FISH and antibody staining shows ilk is expressed in GFP+ BLECs at 4 dpf (arrowheads). n = 17/18 embryos. b–g Inhibition of ILK by cpd22 can partially rescue the absence of BLECs in the egfl7 mutant at 6 dpf (b–e). Quantification of the number of BLECs in the double loops of brain in different treatment groups (f, n = 10 embryos, two-tailed unpaired t test. Data are represented as mean ± SD). The statistics show the percentage of embryos that have double lymphatic loops, single loops, and none of the loops in the brain (g, WT, n = 51 embryos, WT + cpd22, n = 67 embryos, egfl7-/-, n = 116 embryos, egfl7-/- + cpd22, n = 127 embryos, χ2 test).). h–k An egfl7 mutant was crossed with an ilk heterozygote to generate two types of larvae: ilk+/+; egfl7-/- and ilk+/-; egfl7-/-, which were then studied for BLECs loop-structures formation. The larvae were classified into three categories based on their phenotype: Double loops, single loops, and none of the loops (h–j). The results showed that compared to ilk+/+; egfl7-/-, the ilk+/-; egfl7-/- larvae had a decreased percentage of the none of the loops phenotype, and a partially rescued percentage of double loops and single loops phenotype (k, ilk+/+; egfl7-/-, n = 49 embryos, ilk+/-; egfl7-/-, n = 47 embryos, χ2 test). Scale bar, 50 μm. |