Fig. 4
- ID
- ZDB-FIG-240717-25
- Publication
- Chen et al., 2024 - Epidermal growth factor-like domain 7 drives brain lymphatic endothelial cell development through integrin αvβ3
- Other Figures
- All Figure Page
- Back to All Figure Page
|
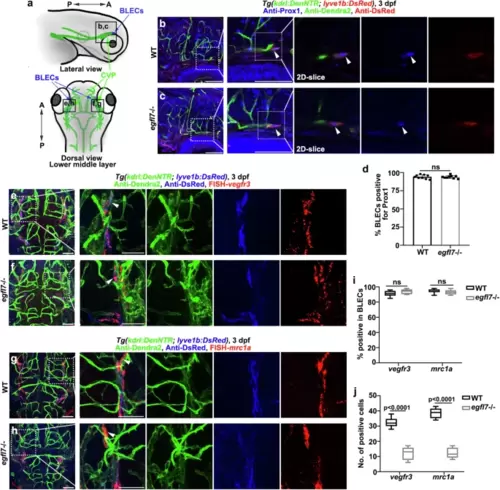
egfl7 is not required for the specification of BLECs progenitors sprout from CVP.a Schematic diagram showing the lateral view and the lower middle layer of the brain, respectively. Black frames indicate the image area of corresponding panels. CVP, choroidal vascular plexus. b, c Immunofluorescence staining for blood endothelial cells (Anti-Dendra2), BLECs (Anti-DsRed), and Anti-Prox1 (blue nuclei) in the WT (b) and egfl7 mutant (c) at 3 dpf. Arrowheads of the magnified 2D single slice image point to the Prox1+ BLECs progenitors sprout from CVP. d The statistics show the ratio of BLECs progenitors positive for Prox1 in WT and egfl7 mutant (n = 9 embryos; two-tailed unpaired t test; ns, no significance. Data are represented as mean ± SD). e–h Confocal image showing the triple labeling of FISH-vegfr3 or FISH-mrc1a, anti-DsRed, and Dendra2 in Tg(kdrl:DenNTR; lyve1b:DsRed) transgenic background in WT (e, g) and egfl7 mutant (f, h). Arrowheads in the magnified image shows vegfr3 mRNA and mrc1a mRNA are expressed in the lyve1b positive and low-level kdrl expressing BLECs progenitors departing the CVP. i The statistics show the ratio of BLECs positive for vegfr3 and mrc1a in WT and egfl7 mutant (n = 8 embryos; 2way ANOVA multiple comparisons test; ns, no significance. Box plots show the five-number summary of a set of data: including the minimum score (shown at the end of the lower whisker), first (lower) quartile, median, third (upper) quartile, and maximum score (shown at the end of the upper whisker)). j The statistics show the number of vegfr3+ and mrc1a + BLECs in WT and egfl7 mutant (n = 8 embryos; 2way ANOVA multiple comparisons test. Box plots show the five-number summary of a set of data: including the minimum score (shown at the end of the lower whisker), first (lower) quartile, median, third (upper) quartile, and maximum score (shown at the end of the upper whisker)). Scale bar, 50 μm. |

