
- Title
-
Large-scale CRISPR screen reveals context-specific genetic regulation of retinal ganglion cell regeneration
- Authors
- Emmerich, K., Hageter, J., Hoang, T., Lyu, P., Sharrock, A.V., Ceisel, A., Thierer, J., Chunawala, Z., Nimmagadda, S., Palazzo, I., Matthews, F., Zhang, L., White, D.T., Rodriguez, C., Graziano, G., Marcos, P., May, A., Mulligan, T., Reibman, B., Saxena, M.T., Ackerley, D.F., Qian, J., Blackshaw, S., Horstick, E., Mumm, J.S.
- Source
- Full text @ Development

Characterization of RGC:YFP-NTR2 paradigm. (A) Whole-fish view of RGC:YFP-NTR2 expression specificity (asterisk indicates zc65-associated myl7:TagRFP ‘tracer’ reporter expression in the heart, not YFP-NTR2 expression). (B) Plate reader-based quantification of YFP loss at 7 dpf (48 hpa) after a 5-6 dpf exposure to Mtz at the indicated concentrations. (C) Experimental setup for analyzing proliferative responses (PCNA immunolabeling) to RGC ablation. (D) Representative PCNA immunostaining (red cells) in the INL and ONL of RGC:YFP-NTR2 retinas treated with or without Mtz (asterisks indicate constitutive proliferation in CMZ). (E) Quantification of PCNA+ cells in the INL at 24, 48, 72 and 96 hpa. (F) Representative confocal images of RGC soma and axonal loss (48 hpa) and regeneration (168 hpa) in the retina (top) and tectum (bottom). (G) Imaris-based volumetric quantification of RGC axon loss and regeneration (YFP) from confocal z-stacks of the tectum. (H) Experimental setup of EdU-based lineage tracing of early retinal progenitors (24 h pulse, 96 hpa chase). (I) Representative images of EdU immunostaining in unablated (Cntr) and RGC-ablated (+Mtz) RGC:YFP-NTR2 larvae (asterisks indicate CMZ cells in the periphery and endothelial cells near the optic nerve; arrowhead marks EdU+ cells in the brain, none of which were included in the quantification). (J) Quantification of EdU+ cells in the GCL. (K) Representative swim traces of visual responses to a lights-off stimulus in control and RGC-ablated (+Mtz) larvae at 0, 48 and 96 hpa. (L) Quantification of visual responses in control and RGC-ablated larvae at 0, 48, 96 and 144 hpa. All white violin plots are unablated control larvae (Cntr), all orange violin plots are RGC-ablated larvae (+Mtz). Pair-wise and multiple comparisons are indicated by single lines and extended lines, respectively. **P≤0.01, ***P≤0.001, ****P≤0.0001; ns, not statistically significant. |

Single cell transcriptomics of response to RGC ablation. (A) Experimental setup for scRNA-seq time series (12, 24, 48 and 72 hpa) of unablated control (no Mtz) and RGC-ablated (+Mtz) larvae. (B) UMAP of major eye cell types from all timepoints collected. (C) Total number of DEGs identified at each timepoint for MG, progenitor cells, RGCs and other major retinal cell classes. (D) MG subclusters. Subcluster 3 is made up predominantly of ‘activated’ MG cells at 12 hpa (blue). (E) Volcano plot of DEGs in 12 hpa MG subcluster. (F) Select MG DEGs at 12, 24, 48 and 72 hpa. (G) Cross-paradigm comparison of MG DEGs from RGC ablation data, and a pooled NDMA and LD dataset. (H) Top upregulated and downregulated RGC paradigm-specific DEGs relative to pooled NDMA and LD dataset. ACs, amacrine cells; BCs, bipolar cells; HCs, horizontal cells; PR, photoreceptor; RGCs, retinal ganglion cells. *P≤0.05. |

Pseudotime trajectory analysis of RGC and rod PR regeneration paradigms. (A) UMAP used to create pseudotime trajectory of MG>progenitor>RGC cells using 0-72 hpa data. (B) Density of unablated (Cntr) and RGC ablated (+Mtz) cells along the trajectory in A. (C) Expression of atoh7 and ascl1a in Cntr (black line) and RGC-ablated data (red line) along trajectory in A. (D) Heatmap of selected DEGs upregulated during RGC loss and regeneration. (E) UMAP used to create pseudotime trajectory of MG>progenitors>rods using 48 hpa data. (F) Density of unablated (Cntr) and rod-ablated (+Mtz) cells along the trajectory in E. (G) Expression of atoh7 and ascl1a in Cntr (black line) and rod-ablated (red line) data along the trajectory in E. (H) Comparison of changes in expression of selected neurogenic genes between RGC ablation (top series) or rod cell ablation (bottom series) paradigms along corresponding pseudotime trajectories. |
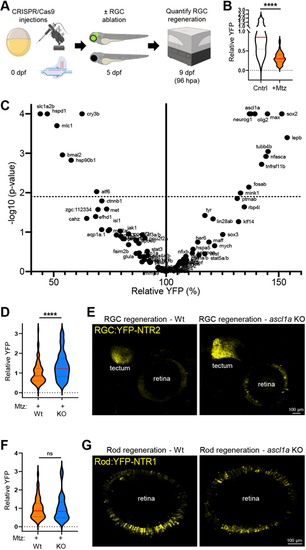
CRISPR screen identifies genes regulating RGC regeneration. (A) Experimental setup for CRISPR/Cas9-based ‘crispant’ knockout (KO) screen for genes that regulate RGC regeneration. (B) Plate reader-based quantification of RGC regeneration at 96 hpa. Relative YFP levels in RGC ablated larvae (+Mtz) are normalized to unablated controls (Cntr). (C) Volcano plot of RGC regeneration (relative YFP levels) for all Mtz-treated RGC:YFP-NTR2 crispant KO larvae (dashed line indicates adjusted P-value cutoff of 0.01; minimum sample size n=8, median sample size n=16). (D) Plate reader-based quantitative comparison of RGC regeneration levels (YFP) between Mtz-treated control (Wt) and ascl1a crispant (KO) larvae at 96 hpa. (E) Representative confocal images of RGC regeneration in Mtz-treated control (Wt) and ascl1a crispant (KO) larvae at 168 hpa. (F) Plate reader-based quantitative comparison of rod cell regeneration levels (YFP) between Mtz-treated control (Wt) and ascl1a crispant (KO) larvae at 96 hpa. (G) Representative confocal images of rod cell regeneration in Mtz-treated control (Wt) and ascl1a crispant (KO) larvae at 168 hpa. ****P≤0.0001; ns, not statistically significant. |
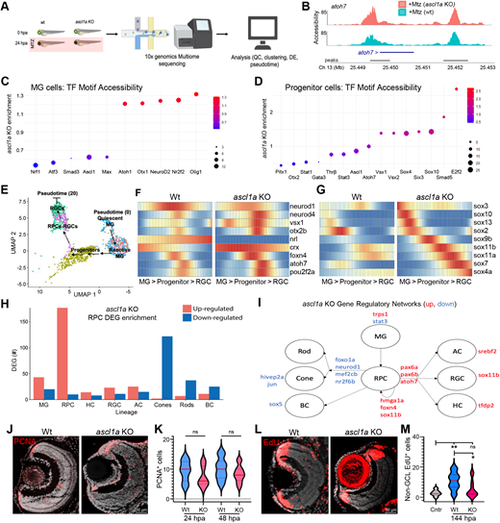
Ascl1a KO accelerates RGC regeneration kinetics by enhancing RGC fate bias. (A) Experimental setup for multiome sequencing (combined snRNA-seq and ATAC-seq) of control (wt) and ascl1a KO larvae at 0 and 24 hpa. (B) Chromatin accessibility comparison between wt and ascl1a KO larvae at the atoh7 locus after RGC ablation (+Mtz). (C) Transcription factor motif accessibility enrichment in MG cells of ascl1a KO larvae. (D) Transcription factor motif accessibility enrichment in progenitor cells of ascl1a KO larvae. (E) UMAP used to create pseudotime trajectory of MG>progenitor>RGC cells. (F,G) Heatmaps of select pro-neural (F) and Sox family (G) TF DEGs across pseudotime for wild-type and ascl1a KO larvae at 24 hpa. (H) DEGs in progenitor cells of ascl1a KO larvae associated with known retinal cell lineages. (I) Derived gene regulatory networks (GRNs) altered in ascl1a KO progenitors based on changes in expression of transcription factors known to regulate DEGs in H. (J) Representative PCNA immunostaining in RGC-ablated control (+Mtz) and RGC-ablated ascl1a crispant (+Mtz, ascl1a KO) retinas. (K) Quantification of PCNA+ cells after RGC ablation at 24 and 48 hpa in wild-type and ascl1a KO retinas. (L) Representative EdU immunostaining images of ‘secondary’ EdU lineage-traced cells (0-48 h EdU pulse, 6-day chase) in RGC-ablated wild-type and ascl1a KO retinas. (M) Quantification of the EdU+ retinal cells in the ONL and INL (excluding CMZ and GCL) in unablated controls and RGC-ablated wild-type and ascl1a KO retinas at 6 dpa. *P≤0.05, **P≤0.01. |