
- Title
-
Disruption of the creb3l1 gene causes defects in caudal fin regeneration and patterning in zebrafish Danio rerio
- Authors
- VanWinkle, P.E., Lee, E., Wynn, B., Nawara, T.J., Thomas, H., Parant, J., Alvarez, C., Serra, R., Sztul, E.
- Source
- Full text @ Dev. Dyn.
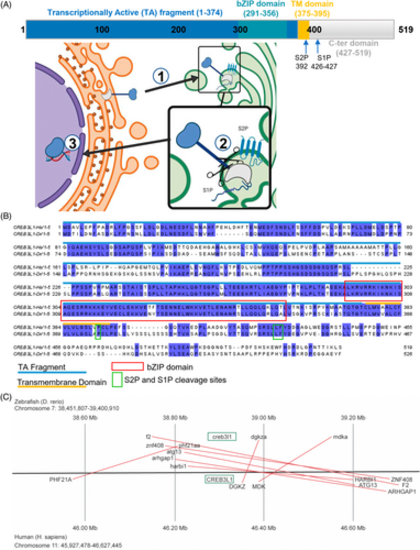
Creb3l1 is a transmembrane transcription factor highly conserved between humans and zebrafish. (A) A schematic of Creb3l1 protein showing the N-terminal transcription activating (TA) region (amino acids 1–374) containing the DNA-binding bZIP domain (amino acids 291–356), followed by a single transmembrane (TM) domain (amino acids 375–395) and the C-terminal luminal domain (amino acids 427–519). The sites cleaved by the S1P and S2P proteases are indicated by arrows. Creb3l1 resides in the endoplasmic reticulum and in response to stress is transported to the Golgi (step 1), where it is cleaved by S1P and S2P proteases (step 2). The released TA fragment then enters the nucleus to regulate transcription of target genes (step 3). (B) Alignment of human and zebrafish Creb3l1. The TA domain is indicated by a blue line and the TM domain is marked by an orange line. The DNA-binding bZIP domain is outlined in red. The sites cleaved by S1P and S2P are boxed in green. The highest level of amino acid conservation is in bZIP, the TM and regions immediately upstream from bZIP. The S1P and S2P cleavage sites also reside within conserved domains. Identical residues are shaded in blue. (C) The genetic loci of human and zebrafish Creb3l1 demonstrate high synteny, sharing 8 genes within the same ~1 megabase span in their respective genomes. |

creb3l1 mutant zebrafish are normal size and exhibit normal overall skeletal morphology and bone density. (A) Exon 2 of the zebrafish creb3l1 gene was targeted to generate creb3l1ΔbZIP/ΔbZIP fish with a +7 bp insertion (in green) that causes a frameshift mutation at amino acid 65 (D to P change). This mutation generates a Creb3l1 fragment encoding only the N-terminal 65 amino acids of Creb3l1, followed by 10 additional amino acids not present in wild-type Creb3l1 (in gray). Yellow highlights wild-type codons while gray highlights mutant codons and amino acids. TGA stop codon is in red. cDNA, consensus coding sequence and protein sequences are shown. (B) creb3l1 mRNA levels were measured by RT-PCR in 7 dpf creb3l1+/+ and creb3l1ΔbZIP/ΔbZIP larvae. Expression of creb3l1 is significantly elevated in the creb3l1ΔbZIP/ΔbZIP larvae. n = 3–4, ***p < .001. Each data point represents a pool of ~30 larvae. (C) Larvae from heterozygous creb3l1ΔbZIP/+ incrosses were genotyped at 7 dpf and show the expected Mendelian ratios. n and p values are indicated. (D) The length of age-matched 6 mpf creb3l1+/+ and creb3l1ΔbZIP/ΔbZIP fish was measured from the snout to the posterior-most point of the tail. There was no significant difference in length between the wild-type and the creb3l1 mutant fish. n = 27–34. Each data point represents an individual fish. (E) Age-matched 3 mpf creb3l1+/+ and creb3l1ΔbZIP/ΔbZIP fish were analyzed by μCT and representative scans of male and female animals are shown. The creb3l1ΔbZIP/ΔbZIP fish exhibit overall normal skeletal morphology. Scale bar = 5 mm. (F) Bone density (mgHA/cm3) of the entire skeleton of male and female creb3l1+/+ and creb3l1ΔbZIP/ΔbZIP fish was determined from the μCT scans. n = 9–11. No significant difference was detected. Each data point represents an individual fish. |

creb3l1 mutant zebrafish exhibit perturbations in caudal fin patterning. (A) Tails of age-matched 6 mpf creb3l1+/+,Tg(Sp7:eGFP)/+ and creb3l1ΔbZIP/ΔbZIP,Tg(Sp7:eGFP)/+ fish were imaged by fluorescence and representative images are shown. Orange lines from the caudal peduncle to the tip of third rays mark distance measured as fin length. Blue lines mark the distance of the most proximal bifurcation point from the caudal peduncle of second rays. Scale bar = 1 mm. (B) Images analogous to those in (A) were used to measure the length of second and third ray on both sides of the fin, and the average length/fin is shown. Each data point represents an individual fish. No difference in tail length was detected. n = 15–17. (C) Images analogous to those in (A) were used to measure the distance between the primary proximal bifurcation and the caudal peduncle of the second and third ray on both sides of the fin. The average distance was calculated and is shown. Each data point represents an individual fish. No difference in the proximo-distal position of the bifurcation point was detected. n = 16–17. (D) Higher magnification of images analogous to those in (A) (the images were “stretched” along the x horizontal axis to more clearly visualize the distinct bifurcations). Rays are numbered starting with the most lateral. Secondary bifurcations of the third ray are indicated by yellow arrows, of the fourth ray by sienna arrows, and of the fifth ray by orange arrows. Secondary bifurcations of the sixth and seventh rays are indicated by blue arrows in wild-type fish and are absent in mutant fish. (E, F) Images analogous to those in (A) were used to measure the total number of bifurcations per fin (E), as well as the number of primary (F), and secondary bifurcations per fin (G). The complexity of bifurcations is lower in the creb3l1 mutant fins, with fewer secondary bifurcations per fin than in wild-type creb3l1 fins. |

creb3l1 mutant zebrafish show defects in the regeneration of the caudal fin. (A) Approximately 50% of the caudal fin was amputated from 6 mpf wild-type fish, and creb3l1 expression was monitored by in situ hybridization at the indicated dpa. creb3l1 signal is predominantly detected at the distal tip of each regenerating ray and appears strongest at 3 dpa (blue arrow). Representative images are shown. n = 3. Amputation planes are indicated with dashed line. Scale bar = 1 mm. (B) Approximately 50% of the caudal fin was amputated from 6 mpf creb3l1+/+ and creb3l1ΔbZIP/ΔbZIP fish. Regenerates at 3 dpa were analyzed by in situ hybridization to assess the expression of col1a1a. In wild-type fins, robust col1a1 signal is detected over each regenerating ray (blue arrows) and immediately below the amputation plane (white arrows). In creb3l1 mutant fins, col1a1 signal is less apparent over the regenerating rays (blue arrows), and is undetectable at the amputation plane (white arrows). n = 3. Scale bar = 1 mm. C-F) Approximately 50% of the caudal fin was amputated from age-matched 6 mpf creb3l1+/+,Tg(Sp7:eGFP)/+ and creb3l1ΔbZIP/ΔbZIP,Tg(Sp7:eGFP)/+ fish, and regeneration was assessed by fluorescence imaging at the indicated dpa. Amputation planes are indicated with white dashed lines. Scale bar = 1 mm. (C) Representative images at each dpa. (D) To quantify regenerate length, lines were drawn manually from the amputation plane to the tip of the second and third lateral rays on both sides of the regenerate (blue lines), measured and averaged. Ray width was measured for all rays within the regenerate (width of representative rays is marked by orange lines) and averaged. The Sp7+-labeled fluorescent area was determined by thresholding the fluorescence signal in each regenerate (representative image is shown in lower panel). (E) Images analogous to those in (C) were used to measure the lengths of the second and third most lateral rays on both sides of the fin as in (D). Each data point represents an individual fish. The creb3l1ΔbZIP/ΔbZIP,Tg(Sp7:eGFP/+) fish show significantly shorter regenerates at 3, 7, and 9 dpa. n = 13–23. *p ≤ .05; **p ≤ .01; ***p ≤ .001. (F) Images analogous to those in C were used to calculate the area occupied by Sp7+ labeled osteoblasts within the regenerate, corrected for the average ray width (total Sp7+ area/average ray width) as in (D). Each data point represents an individual fish. The creb3l1ΔbZIP/ΔbZIP,Tg(Sp7:eGFP/+) fish show significantly decreased Sp7+ area/ray at all timepoints. n = 13–23. **p ≤ .01; ***p ≤ .001; ****p ≤ .0001. |
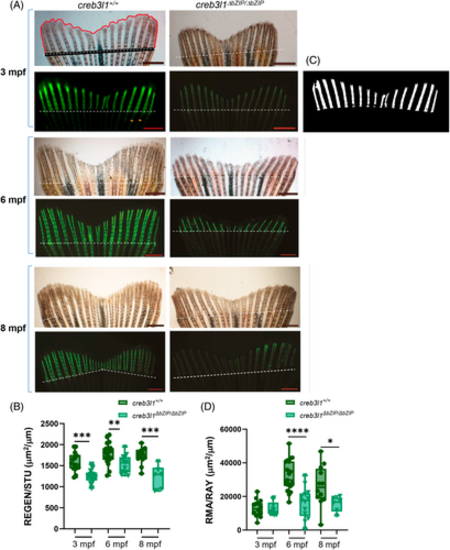
creb3l1 mutant zebrafish show defects in the ossification of the regenerating caudal fin. (A) Approximately 50% of the caudal fin was amputated from 3 mpf, 6 mpf, and 8 mpf creb3l1+/+ and creb3l1ΔbZIP/ΔbZIP fish. At 9 dpa, the tail regenerates were visualized in bright-field (upper panels) and after staining with calcein fluorophore to visualize mineralized tissue (green, lower panels). Representative images are shown. A representative bright-field image shows manually traced regenerate outline (red line) and the stump width (black line). A representative fluorescent image shows manually traced width of rays (orange lines mark two rays) within the fin. Amputation planes are indicated with dashed line. Scale bar = 1 mm. (B) Bright-field images analogous to those in (A) were used to calculate the regenerate area enclosed by the red and black lines (shown in A) and corrected for the stump width (REGEN/STU). Each data point represents an individual fish. The creb3l1 mutant fish show significantly smaller regenerates than the wild-type fish. n = 6–19. **p ≤ .01; ***p ≤ .001. (C) Representative threshold of calcein-stained regenerate used to analyze mineralized area. (D) Fluorescence images analogous to those in (A) were thresholded and used to calculate the area of mineralized bone corrected for the average width of the rays (RMA/RAY). Each data point represents an individual fish. The creb3l1 mutant fish show significantly less mineralization than wild-type fish. n = 6–19. *p ≤ .05; ****p ≤ .0001. |
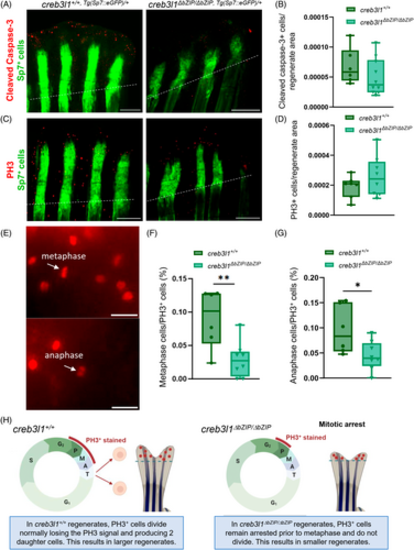
creb3l1 mutant zebrafish show mitotic defects during regeneration. (A–G) Approximately 50% of the caudal fin was amputated from age-matched 6 mpf creb3l1+/+,Tg(Sp7:eGFP)/+ and creb3l1ΔbZIP/ΔbZIP,Tg(Sp7:eGFP)/+ fish. At 3 dpa, the regenerating tails were processed with antibodies to cleaved caspase-3 or PH3, followed by secondary antibodies conjugated to Alexa-594 (red) fluorophore, and then imaged by bright-field (not shown) and fluorescence (representative images of regenerates stained for cleaved caspase (A) or PH3 (C)). Amputation planes are indicated with dashed line. Scale bar = 1 mm. (B) Bright-field and fluorescent images analogous to those in (A) were used to measure total regenerate area (as in Figure 5A) and to count the number of cells positive for cleaved caspase-3 within the entire regenerate. The results are presented as the number of stained cells per whole regenerate area. Each data point represents an individual fish. n = 6–10. No significant difference was seen between the wild-type and creb3l1 mutant fish. (D) Bright-field and fluorescent images analogous to those in C were used to measure total regenerate area (as in Figure 5A) and to count the number of cells positive for PH3 in the entire regenerate. The results are presented as the number of stained cells per whole regenerate area. Each data point represents an individual fish. n = 6–10. No significant difference was seen between the wild-type and creb3l1 mutant fish. (E) Regenerates stained for PH3 were imaged at higher magnification to identify metaphase and anaphase cells (white arrows). Representative images are shown. Metaphase cells were defined as cells with an elongated, non-circular nuclear signal (the metaphase plate). Anaphase cells were defined as cells with chromosomes appearing to be pulled to opposite poles of the cell. Scale bar = 20 μm. (F, G) Fluorescent images of regenerates stained for PH3 were used to count cells in metaphase (F) and anaphase (G) and are presented as a ratio to total PH3+ cells counted within the imaged regenerate. creb3l1ΔbZIP/ΔbZIP,Tg(Sp7:eGFP)/+ fish have significantly fewer cells in metaphase and anaphase. n = 6–8. *p ≤ .05, **p ≤ .01. (H) Diagram of proposed mechanism to reconcile similar PH3 staining with decreased regenerate size in creb3l1ΔbZIP/ΔbZIP fish relative to creb3l1+/+ fish. In wild-type fish, PH3+ cells complete mitosis to generate two daughter cells, and rapidly loose the PH3 signal in late anaphase. In contrast, in creb3l1 mutant fish, PH3+ cells remain arrested at lateG2/early mitosis M, and continue to be stained with PH3, but do not complete cell division. Such cell cycle arrest would lead to overall smaller regenerates in creb3l1 mutant fish. |
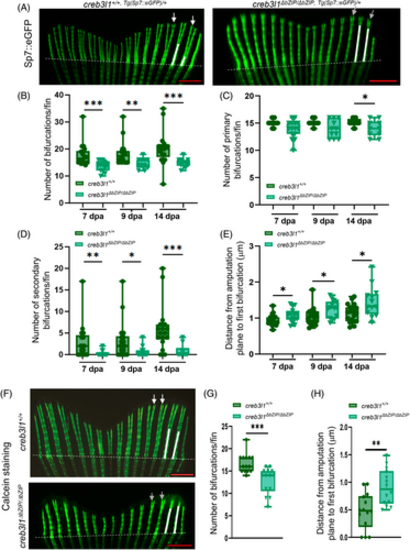
creb3l1 mutant zebrafish exhibit bifurcation defects during regeneration of the caudal fin. (A) Approximately 50% of the caudal fin was amputated from 6 mpf creb3l1+/+,Tg(Sp7:eGFP)/+ and creb3l1ΔbZIP/ΔbZIP,Tg(Sp7:eGFP)/+ fish. At different dpa, the tails were imaged directly by fluorescence. Representative images of 7 dpa regenerates are shown. Amputation planes are marked with dashed white lines. The distance between the amputation plane and the primary bifurcation point in the second and third ray is marked with white lines. In wild-type fish, secondary bifurcations are indicated by white arrows. In mutant fish, lack of secondary bifurcation is marked with gray arrows. Scale bar = 1 mm. (B) Images analogous to those in (A) were used to quantitate the number of total bifurcations in a 7, 9, and 14 dpa fin regenerate. Each data point represents an individual fish. n = 10–18. **p ≤ .01; ***p ≤ .001. (C) Images analogous to those in (A) were used to quantitate the number of primary bifurcations in a 7, 9, and 14 dpa fin regenerate. Each data point represents an individual fish. n = 10–18. *p ≤ .05. (D) Images analogous to those in (A) were used to quantitate the number of secondary bifurcations in a 7, 9, and 14 dpa fin regenerate. Each data point represents an individual fish. n = 10–18. *p ≤ .05; **p ≤ .01; ***p ≤ .001. (E) Images analogous to those in (A) were used to quantitate the distance from the amputation plane to first bifurcation in the second and third ray in the regenerate. Each data point represents an individual fish. Significant increase in distance is observed in creb3l1ΔbZIP/ΔbZIP,Tg(Sp7:eGFP)/+ fish at all dpa. n = 12–20. *p ≤ .05. (F) Approximately 50% of the caudal fin was amputated from 6 mpf creb3l1+/+ and creb3l1ΔbZIP/ΔbZIP fish. At 9 dpa, the tails were stained with calcein fluorophore and imaged by fluorescence. Representative images of regenerates are shown. Amputation planes are indicated with dashed white lines. The distance between the amputation plane and the primary bifurcation point in the second and third ray is marked with white lines. In wild-type fish, secondary bifurcations are indicated by white arrowheads. In mutant fish, lack of secondary bifurcation is marked with gray arrows. Scale bar = 1 mm. (G) Images analogous to those in F were used to quantitate the total number of bifurcations in the regenerating fin. Each data point represents an individual fish. n = 14. ***p ≤ .001. (H) Images analogous to those in F were used quantitate the distance from the amputation plane to first bifurcation in the second and third ray in the regenerate. Significant increase in distance is observed in creb3l1ΔbZIP/ΔbZIP mutant fish. n = 14. **p ≤ .01. |

creb3l1 mutant fish exhibit aberrant patterning of shha and ptch2. (A, B) Approximately 50% of the caudal fin was amputated from 6 mpf creb3l1+/+ and creb3l1ΔbZIP/ΔbZIP fish. Regenerates at 3 dpa (A) and 7 dpa (B) were analyzed by in situ hybridization to assess the expression patterns of shha and ptch2. Amputation planes are indicated with dashed white line. Scale bar = 1 mm. (A) The shha signal in wild-type creb3l1+/+ fish exhibits the characteristic two-point staining (black arrows). In contrast, in creb3l1 mutant fish, shha signal is largely in a single domain over the regenerating ray (blue arrow). The ptch2 signal in wild-type creb3l1+/+ regenerate is segregated into defined caps over regenerating rays with unstained areas between the caps (white arrow). In contrast, patch2 expression is more diffuse in creb3l1ΔbZIP/ΔbZIP regenerate (white arrow). (B) In wild-type creb3l1 fish, the shha signal appears in two clearly separated foci over each bifurcated ray (black arrows). In contrast, shha signal is more diffuse in creb3l1 mutant regenerates (blue arrow). The ptch2 signal in wild-type creb3l1+/+ fish segregates into two domains over each bifurcated ray (white arrows). In contrast, in creb3l1ΔbZIP/ΔbZIP mutant regenerate, ptch2 signal predominantly remains within a single diffuse domain (white arrows). n = 3–7. |