
|
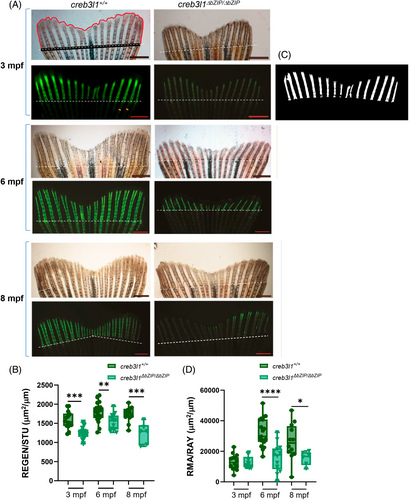
Fig. 5 creb3l1 mutant zebrafish show defects in the ossification of the regenerating caudal fin. (A) Approximately 50% of the caudal fin was amputated from 3 mpf, 6 mpf, and 8 mpf creb3l1+/+ and creb3l1ΔbZIP/ΔbZIP fish. At 9 dpa, the tail regenerates were visualized in bright-field (upper panels) and after staining with calcein fluorophore to visualize mineralized tissue (green, lower panels). Representative images are shown. A representative bright-field image shows manually traced regenerate outline (red line) and the stump width (black line). A representative fluorescent image shows manually traced width of rays (orange lines mark two rays) within the fin. Amputation planes are indicated with dashed line. Scale bar = 1 mm. (B) Bright-field images analogous to those in (A) were used to calculate the regenerate area enclosed by the red and black lines (shown in A) and corrected for the stump width (REGEN/STU). Each data point represents an individual fish. The creb3l1 mutant fish show significantly smaller regenerates than the wild-type fish. n = 6–19. **p ≤ .01; ***p ≤ .001. (C) Representative threshold of calcein-stained regenerate used to analyze mineralized area. (D) Fluorescence images analogous to those in (A) were thresholded and used to calculate the area of mineralized bone corrected for the average width of the rays (RMA/RAY). Each data point represents an individual fish. The creb3l1 mutant fish show significantly less mineralization than wild-type fish. n = 6–19. *p ≤ .05; ****p ≤ .0001.