
|
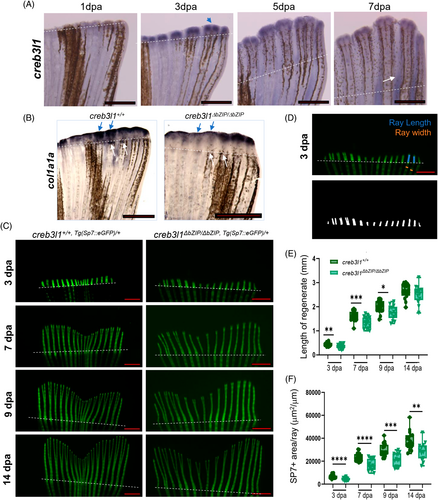
Fig. 4 creb3l1 mutant zebrafish show defects in the regeneration of the caudal fin. (A) Approximately 50% of the caudal fin was amputated from 6 mpf wild-type fish, and creb3l1 expression was monitored by in situ hybridization at the indicated dpa. creb3l1 signal is predominantly detected at the distal tip of each regenerating ray and appears strongest at 3 dpa (blue arrow). Representative images are shown. n = 3. Amputation planes are indicated with dashed line. Scale bar = 1 mm. (B) Approximately 50% of the caudal fin was amputated from 6 mpf creb3l1+/+ and creb3l1ΔbZIP/ΔbZIP fish. Regenerates at 3 dpa were analyzed by in situ hybridization to assess the expression of col1a1a. In wild-type fins, robust col1a1 signal is detected over each regenerating ray (blue arrows) and immediately below the amputation plane (white arrows). In creb3l1 mutant fins, col1a1 signal is less apparent over the regenerating rays (blue arrows), and is undetectable at the amputation plane (white arrows). n = 3. Scale bar = 1 mm. C-F) Approximately 50% of the caudal fin was amputated from age-matched 6 mpf creb3l1+/+,Tg(Sp7:eGFP)/+ and creb3l1ΔbZIP/ΔbZIP,Tg(Sp7:eGFP)/+ fish, and regeneration was assessed by fluorescence imaging at the indicated dpa. Amputation planes are indicated with white dashed lines. Scale bar = 1 mm. (C) Representative images at each dpa. (D) To quantify regenerate length, lines were drawn manually from the amputation plane to the tip of the second and third lateral rays on both sides of the regenerate (blue lines), measured and averaged. Ray width was measured for all rays within the regenerate (width of representative rays is marked by orange lines) and averaged. The Sp7+-labeled fluorescent area was determined by thresholding the fluorescence signal in each regenerate (representative image is shown in lower panel). (E) Images analogous to those in (C) were used to measure the lengths of the second and third most lateral rays on both sides of the fin as in (D). Each data point represents an individual fish. The creb3l1ΔbZIP/ΔbZIP,Tg(Sp7:eGFP/+) fish show significantly shorter regenerates at 3, 7, and 9 dpa. n = 13–23. *p ≤ .05; **p ≤ .01; ***p ≤ .001. (F) Images analogous to those in C were used to calculate the area occupied by Sp7+ labeled osteoblasts within the regenerate, corrected for the average ray width (total Sp7+ area/average ray width) as in (D). Each data point represents an individual fish. The creb3l1ΔbZIP/ΔbZIP,Tg(Sp7:eGFP/+) fish show significantly decreased Sp7+ area/ray at all timepoints. n = 13–23. **p ≤ .01; ***p ≤ .001; ****p ≤ .0001.