
Fig. 6
- ID
- ZDB-FIG-250103-33
- Publication
- VanWinkle et al., 2024 - Disruption of the creb3l1 gene causes defects in caudal fin regeneration and patterning in zebrafish Danio rerio
- Other Figures
- All Figure Page
- Back to All Figure Page
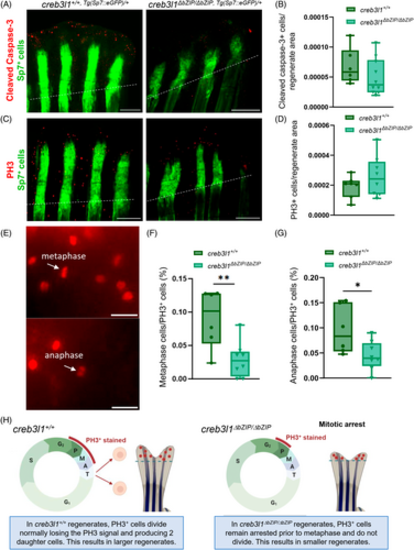
creb3l1 mutant zebrafish show mitotic defects during regeneration. (A–G) Approximately 50% of the caudal fin was amputated from age-matched 6 mpf creb3l1+/+,Tg(Sp7:eGFP)/+ and creb3l1ΔbZIP/ΔbZIP,Tg(Sp7:eGFP)/+ fish. At 3 dpa, the regenerating tails were processed with antibodies to cleaved caspase-3 or PH3, followed by secondary antibodies conjugated to Alexa-594 (red) fluorophore, and then imaged by bright-field (not shown) and fluorescence (representative images of regenerates stained for cleaved caspase (A) or PH3 (C)). Amputation planes are indicated with dashed line. Scale bar = 1 mm. (B) Bright-field and fluorescent images analogous to those in (A) were used to measure total regenerate area (as in Figure 5A) and to count the number of cells positive for cleaved caspase-3 within the entire regenerate. The results are presented as the number of stained cells per whole regenerate area. Each data point represents an individual fish. n = 6–10. No significant difference was seen between the wild-type and creb3l1 mutant fish. (D) Bright-field and fluorescent images analogous to those in C were used to measure total regenerate area (as in Figure 5A) and to count the number of cells positive for PH3 in the entire regenerate. The results are presented as the number of stained cells per whole regenerate area. Each data point represents an individual fish. n = 6–10. No significant difference was seen between the wild-type and creb3l1 mutant fish. (E) Regenerates stained for PH3 were imaged at higher magnification to identify metaphase and anaphase cells (white arrows). Representative images are shown. Metaphase cells were defined as cells with an elongated, non-circular nuclear signal (the metaphase plate). Anaphase cells were defined as cells with chromosomes appearing to be pulled to opposite poles of the cell. Scale bar = 20 μm. (F, G) Fluorescent images of regenerates stained for PH3 were used to count cells in metaphase (F) and anaphase (G) and are presented as a ratio to total PH3+ cells counted within the imaged regenerate. creb3l1ΔbZIP/ΔbZIP,Tg(Sp7:eGFP)/+ fish have significantly fewer cells in metaphase and anaphase. n = 6–8. *p ≤ .05, **p ≤ .01. (H) Diagram of proposed mechanism to reconcile similar PH3 staining with decreased regenerate size in creb3l1ΔbZIP/ΔbZIP fish relative to creb3l1+/+ fish. In wild-type fish, PH3+ cells complete mitosis to generate two daughter cells, and rapidly loose the PH3 signal in late anaphase. In contrast, in creb3l1 mutant fish, PH3+ cells remain arrested at lateG2/early mitosis M, and continue to be stained with PH3, but do not complete cell division. Such cell cycle arrest would lead to overall smaller regenerates in creb3l1 mutant fish. |