
Fig. 7
- ID
- ZDB-FIG-250103-34
- Publication
- VanWinkle et al., 2024 - Disruption of the creb3l1 gene causes defects in caudal fin regeneration and patterning in zebrafish Danio rerio
- Other Figures
- All Figure Page
- Back to All Figure Page
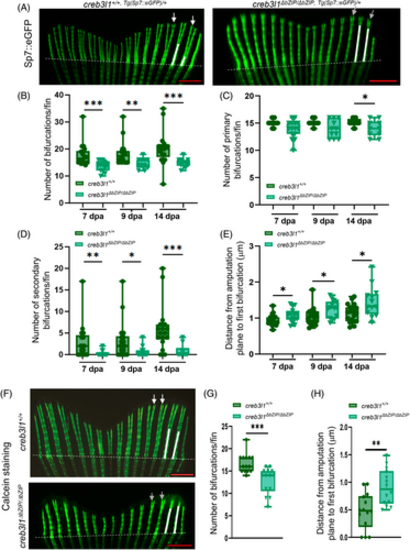
creb3l1 mutant zebrafish exhibit bifurcation defects during regeneration of the caudal fin. (A) Approximately 50% of the caudal fin was amputated from 6 mpf creb3l1+/+,Tg(Sp7:eGFP)/+ and creb3l1ΔbZIP/ΔbZIP,Tg(Sp7:eGFP)/+ fish. At different dpa, the tails were imaged directly by fluorescence. Representative images of 7 dpa regenerates are shown. Amputation planes are marked with dashed white lines. The distance between the amputation plane and the primary bifurcation point in the second and third ray is marked with white lines. In wild-type fish, secondary bifurcations are indicated by white arrows. In mutant fish, lack of secondary bifurcation is marked with gray arrows. Scale bar = 1 mm. (B) Images analogous to those in (A) were used to quantitate the number of total bifurcations in a 7, 9, and 14 dpa fin regenerate. Each data point represents an individual fish. n = 10–18. **p ≤ .01; ***p ≤ .001. (C) Images analogous to those in (A) were used to quantitate the number of primary bifurcations in a 7, 9, and 14 dpa fin regenerate. Each data point represents an individual fish. n = 10–18. *p ≤ .05. (D) Images analogous to those in (A) were used to quantitate the number of secondary bifurcations in a 7, 9, and 14 dpa fin regenerate. Each data point represents an individual fish. n = 10–18. *p ≤ .05; **p ≤ .01; ***p ≤ .001. (E) Images analogous to those in (A) were used to quantitate the distance from the amputation plane to first bifurcation in the second and third ray in the regenerate. Each data point represents an individual fish. Significant increase in distance is observed in creb3l1ΔbZIP/ΔbZIP,Tg(Sp7:eGFP)/+ fish at all dpa. n = 12–20. *p ≤ .05. (F) Approximately 50% of the caudal fin was amputated from 6 mpf creb3l1+/+ and creb3l1ΔbZIP/ΔbZIP fish. At 9 dpa, the tails were stained with calcein fluorophore and imaged by fluorescence. Representative images of regenerates are shown. Amputation planes are indicated with dashed white lines. The distance between the amputation plane and the primary bifurcation point in the second and third ray is marked with white lines. In wild-type fish, secondary bifurcations are indicated by white arrowheads. In mutant fish, lack of secondary bifurcation is marked with gray arrows. Scale bar = 1 mm. (G) Images analogous to those in F were used to quantitate the total number of bifurcations in the regenerating fin. Each data point represents an individual fish. n = 14. ***p ≤ .001. (H) Images analogous to those in F were used quantitate the distance from the amputation plane to first bifurcation in the second and third ray in the regenerate. Significant increase in distance is observed in creb3l1ΔbZIP/ΔbZIP mutant fish. n = 14. **p ≤ .01. |