
- Title
-
Transcriptomic Characterization of Key Factors and Signaling Pathways for the Regeneration of Partially Hepatectomized Liver in Zebrafish
- Authors
- Song, G., Feng, G., Li, Q., Peng, J., Ge, W., Long, Y., Cui, Z.
- Source
- Full text @ Int. J. Mol. Sci.
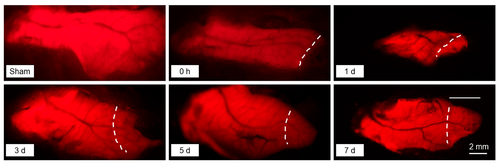
Representative photos for the regenerating liver at the indicated times after the PHx surgery. The white dashed curves indicate the cutting edge resulting from the PHx surgery. The regions to the right of the curves are regenerated tissue after hepatectomy. The Tg(fabp10a:dsRed; ela3l:EGFP) transgenic fish line specifically expressing DsRed in the liver was used for the experiment. |
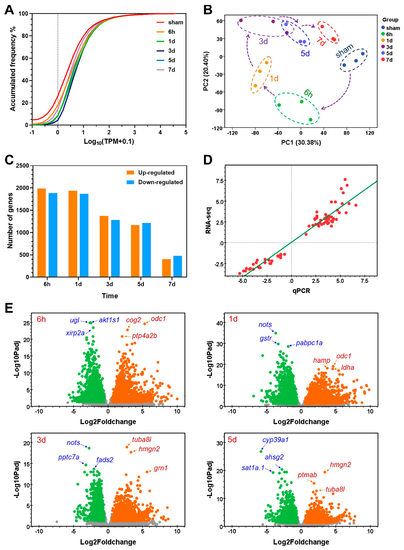
Overall changes in gene expression after partial ventral lobe hepatectomy in zebrafish. (A) Frequency distribution of gene transcriptional abundance for the experimental groups. The dashed line indicates a cumulative ratio of the low abundance genes under the indicated conditions. (B) Principal component analysis of the gene abundance data. (C) Numbers of the up- and down-regulated genes at the indicated time points after the PHx surgery. (D) Correlation between the qPCR and RNA-seq data. (E) Volcano plots demonstrating the DEGs at different time points. Yellow, up-regulated; green, down-regulated; gray, unchanged. Names of the most significantly up- (red) and down-regulated (blue) genes are shown. |
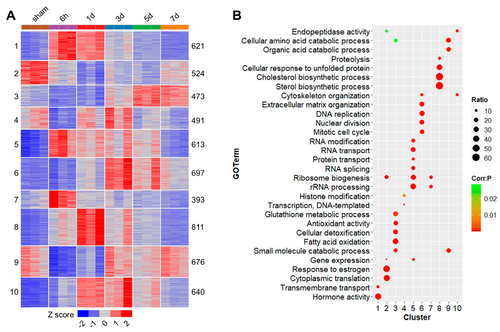
Cluster analysis for the DEGs and GO enrichments, network eigengene values and hubs for the gene clusters. (A) A heatmap demonstrating results of K-means clustering for the DEGs. The cluster numbers (left) and numbers of DEGs contained in the clusters (right) are also shown. (B) Gene ontology enrichments for the DEG clusters. Ratio, ratio of the identified genes relative to all of the genes in the genome associated with the GO term; Corr. P, corrected p value for the enrichment analysis. |
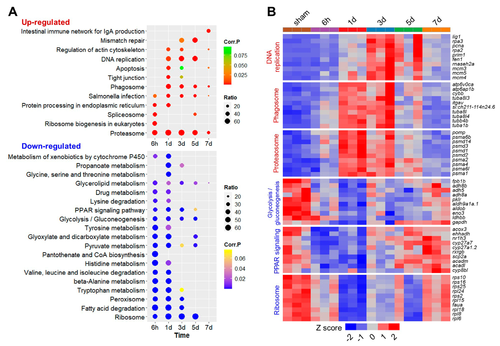
KEGG enrichments for the up- and down-regulated genes after the PHx surgery. (A) Bubble plots illustrating the KEGG pathway enrichments for the DEGs. (B) Heatmaps illustrating expression profiles of the representative genes associated with the top pathways enriched for the up- (red) and down-regulated (blue) genes. Pathway names are shown at the left and gene names are shown at the right. |
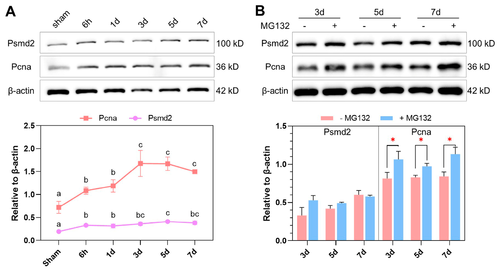
Effects of modulating proteasome activity on liver regeneration. (A) Representative Western blots demonstrating levels of Psmd2 and Pcna proteins during liver regeneration after the PH surgery. (B) Representative Western blots demonstrating effects of MG132 on Psmd2 and Pcna expression during liver regeneration after the PHx surgery. The line chart and bar chart below the Western blots demonstrate the abundance of the target proteins relative to that of β-actin. Different letters above the error bars denote significant differences among the means (p < 0.05, n = 3, one-way ANOVA followed by Duncan’s test); *, p < 0.05, n = 3 (independent samples t-test). |