
Image
|
Figure Caption
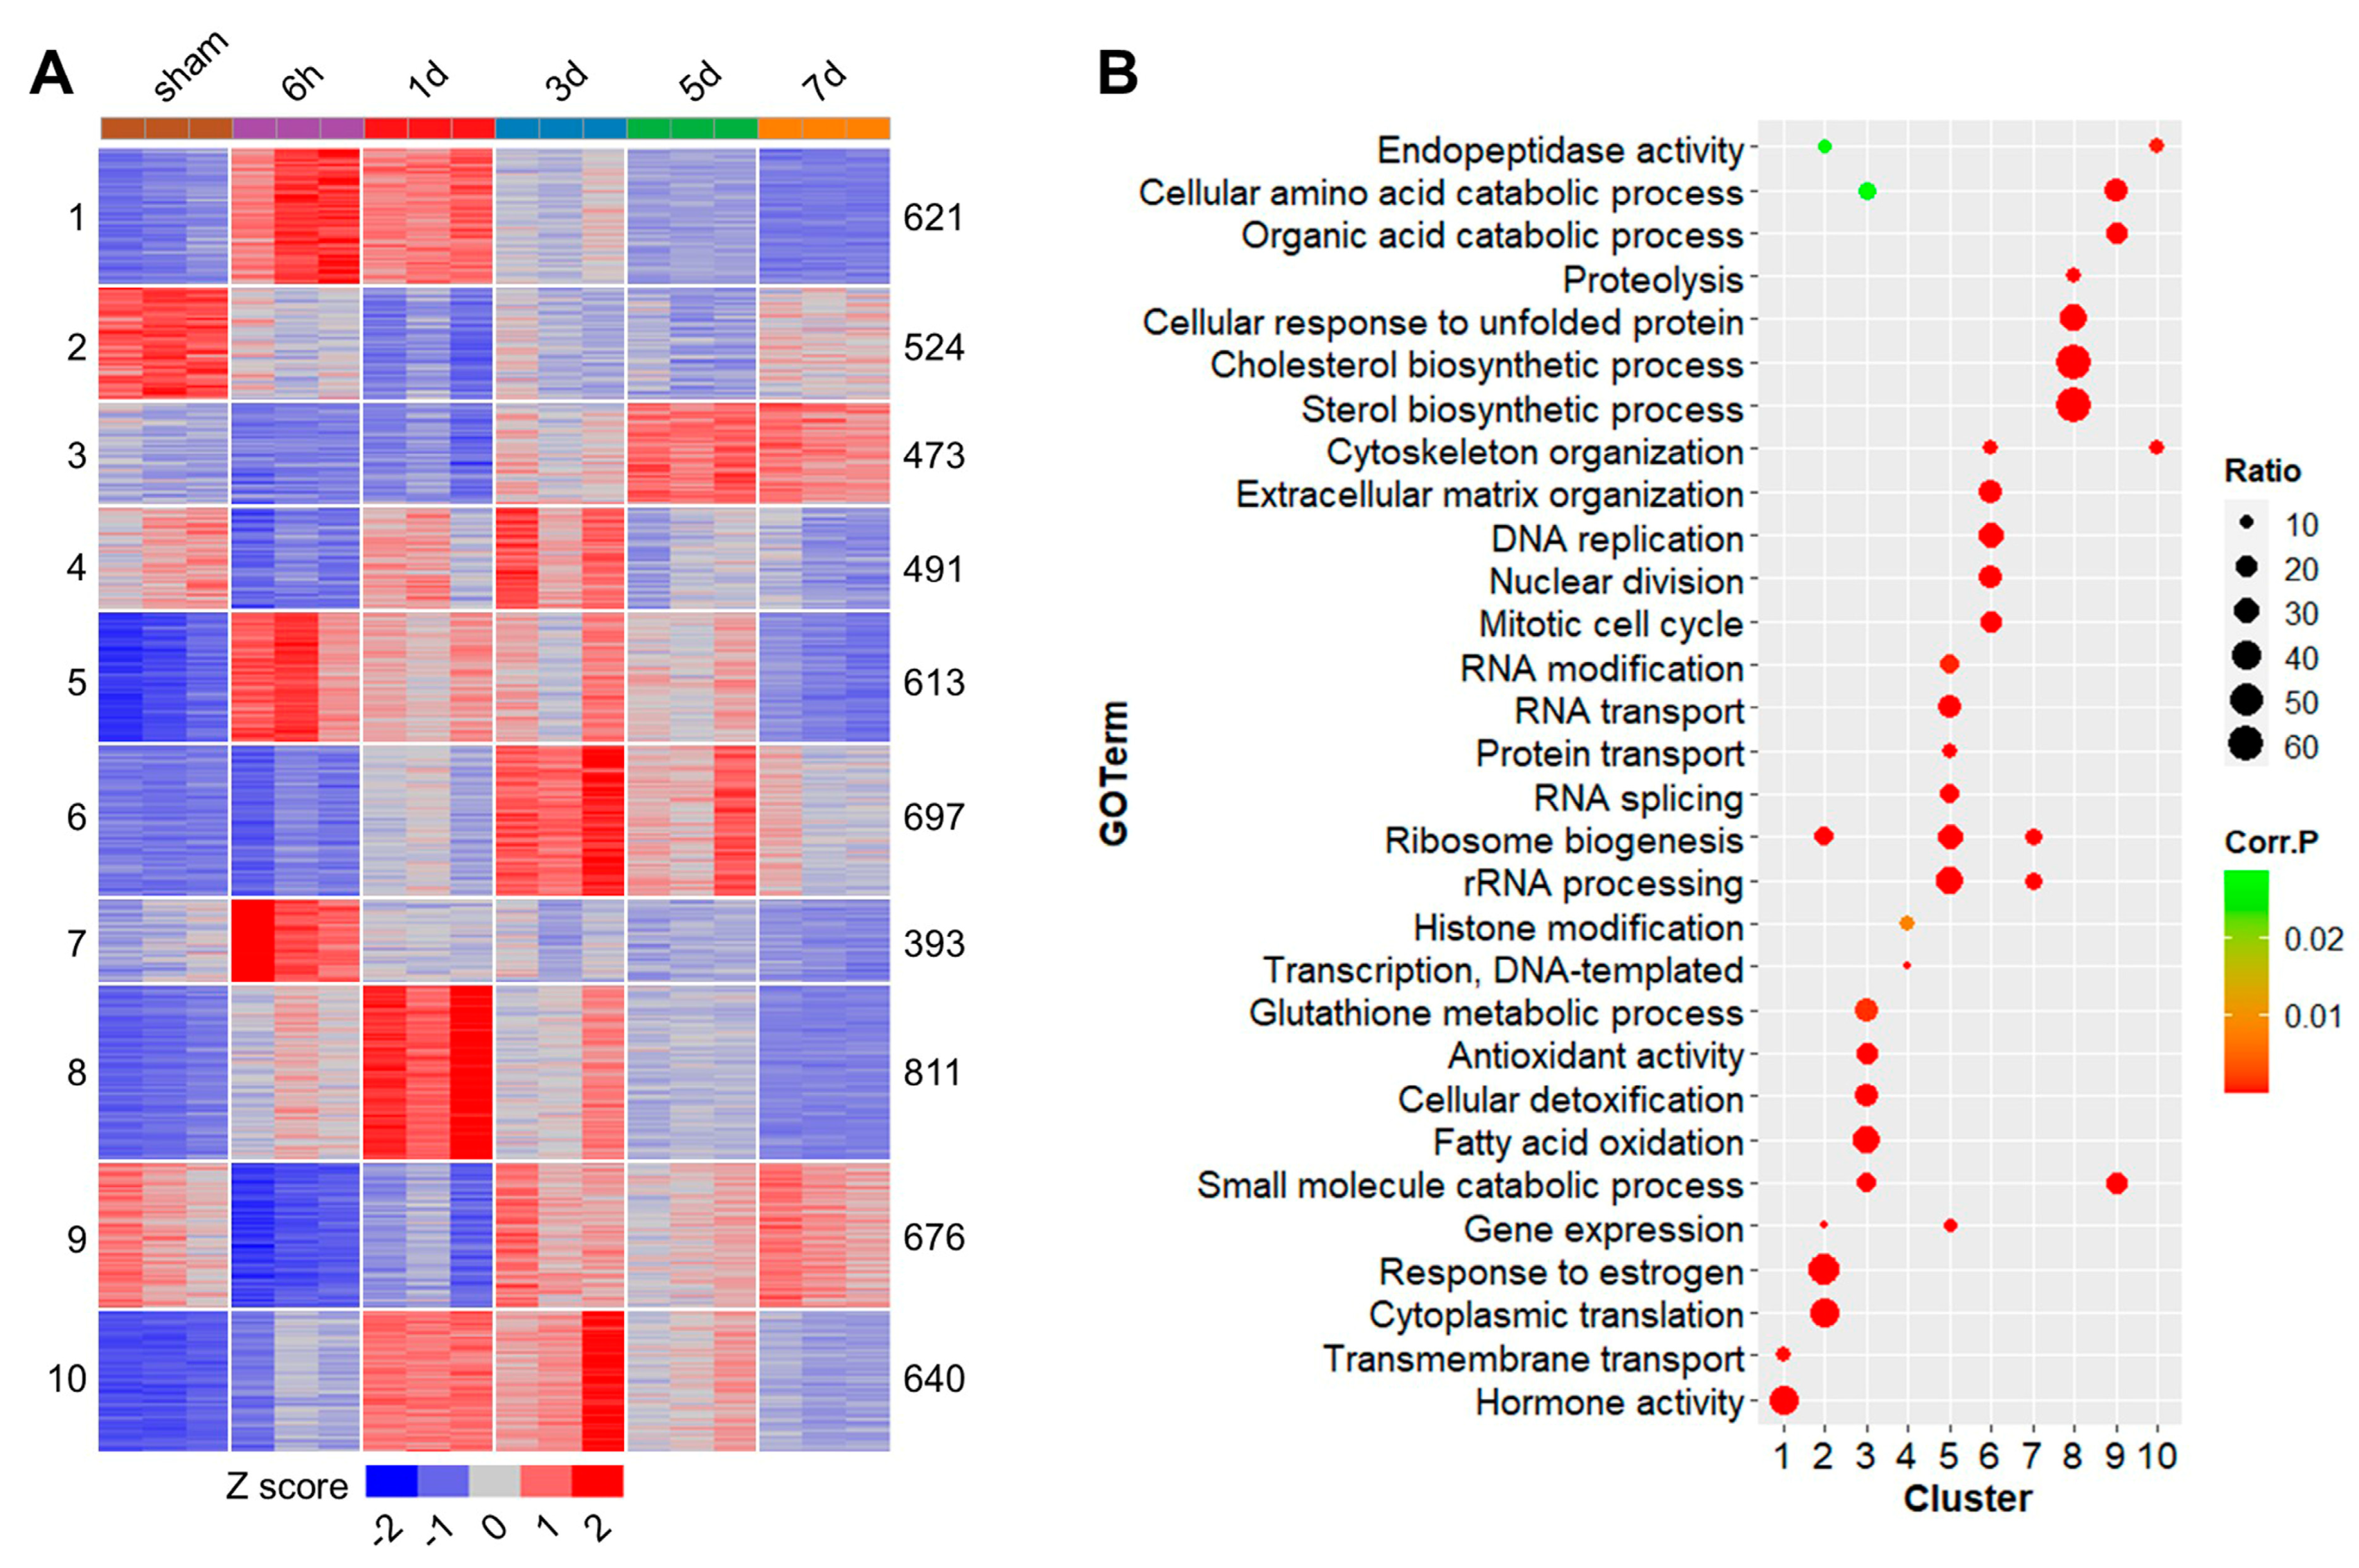
Fig. 3 Cluster analysis for the DEGs and GO enrichments, network eigengene values and hubs for the gene clusters. (A) A heatmap demonstrating results of K-means clustering for the DEGs. The cluster numbers (left) and numbers of DEGs contained in the clusters (right) are also shown. (B) Gene ontology enrichments for the DEG clusters. Ratio, ratio of the identified genes relative to all of the genes in the genome associated with the GO term; Corr. P, corrected p value for the enrichment analysis.
Acknowledgments
This image is the copyrighted work of the attributed author or publisher, and
ZFIN has permission only to display this image to its users.
Additional permissions should be obtained from the applicable author or publisher of the image.
Full text @ Int. J. Mol. Sci.