
Image
|
Figure Caption
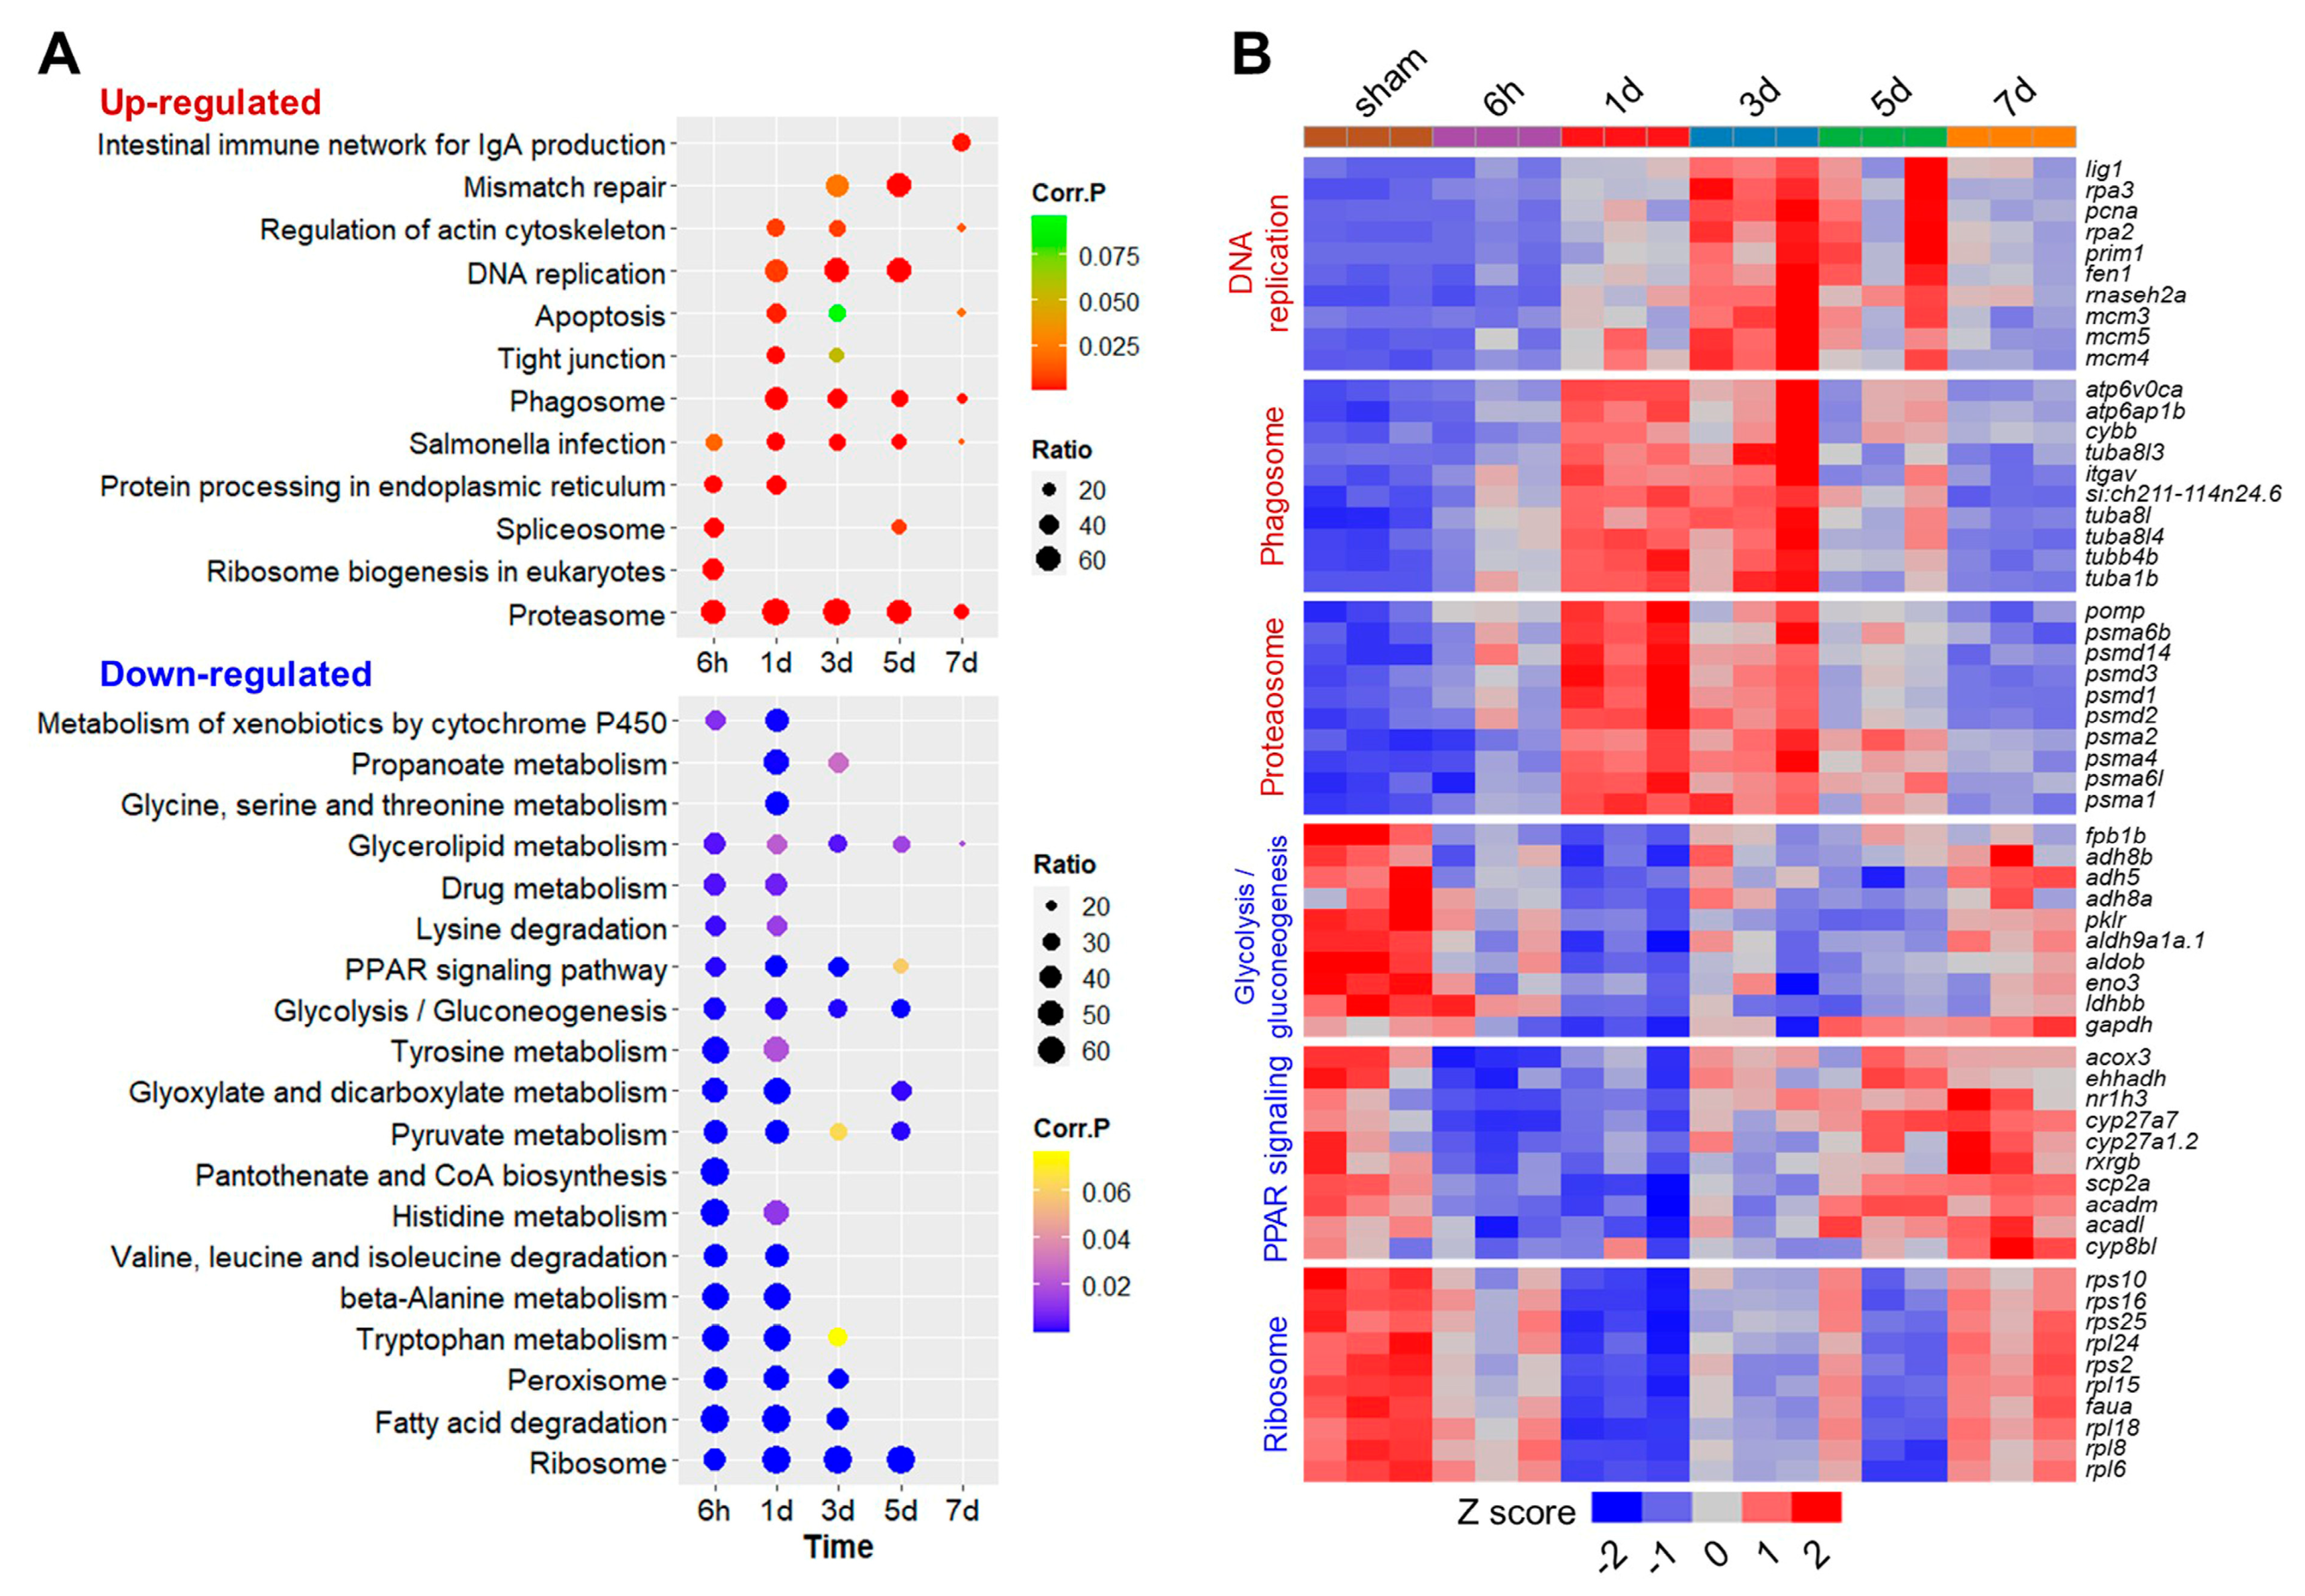
Fig. 4 KEGG enrichments for the up- and down-regulated genes after the PHx surgery. (A) Bubble plots illustrating the KEGG pathway enrichments for the DEGs. (B) Heatmaps illustrating expression profiles of the representative genes associated with the top pathways enriched for the up- (red) and down-regulated (blue) genes. Pathway names are shown at the left and gene names are shown at the right.
Acknowledgments
This image is the copyrighted work of the attributed author or publisher, and
ZFIN has permission only to display this image to its users.
Additional permissions should be obtained from the applicable author or publisher of the image.
Full text @ Int. J. Mol. Sci.