
|
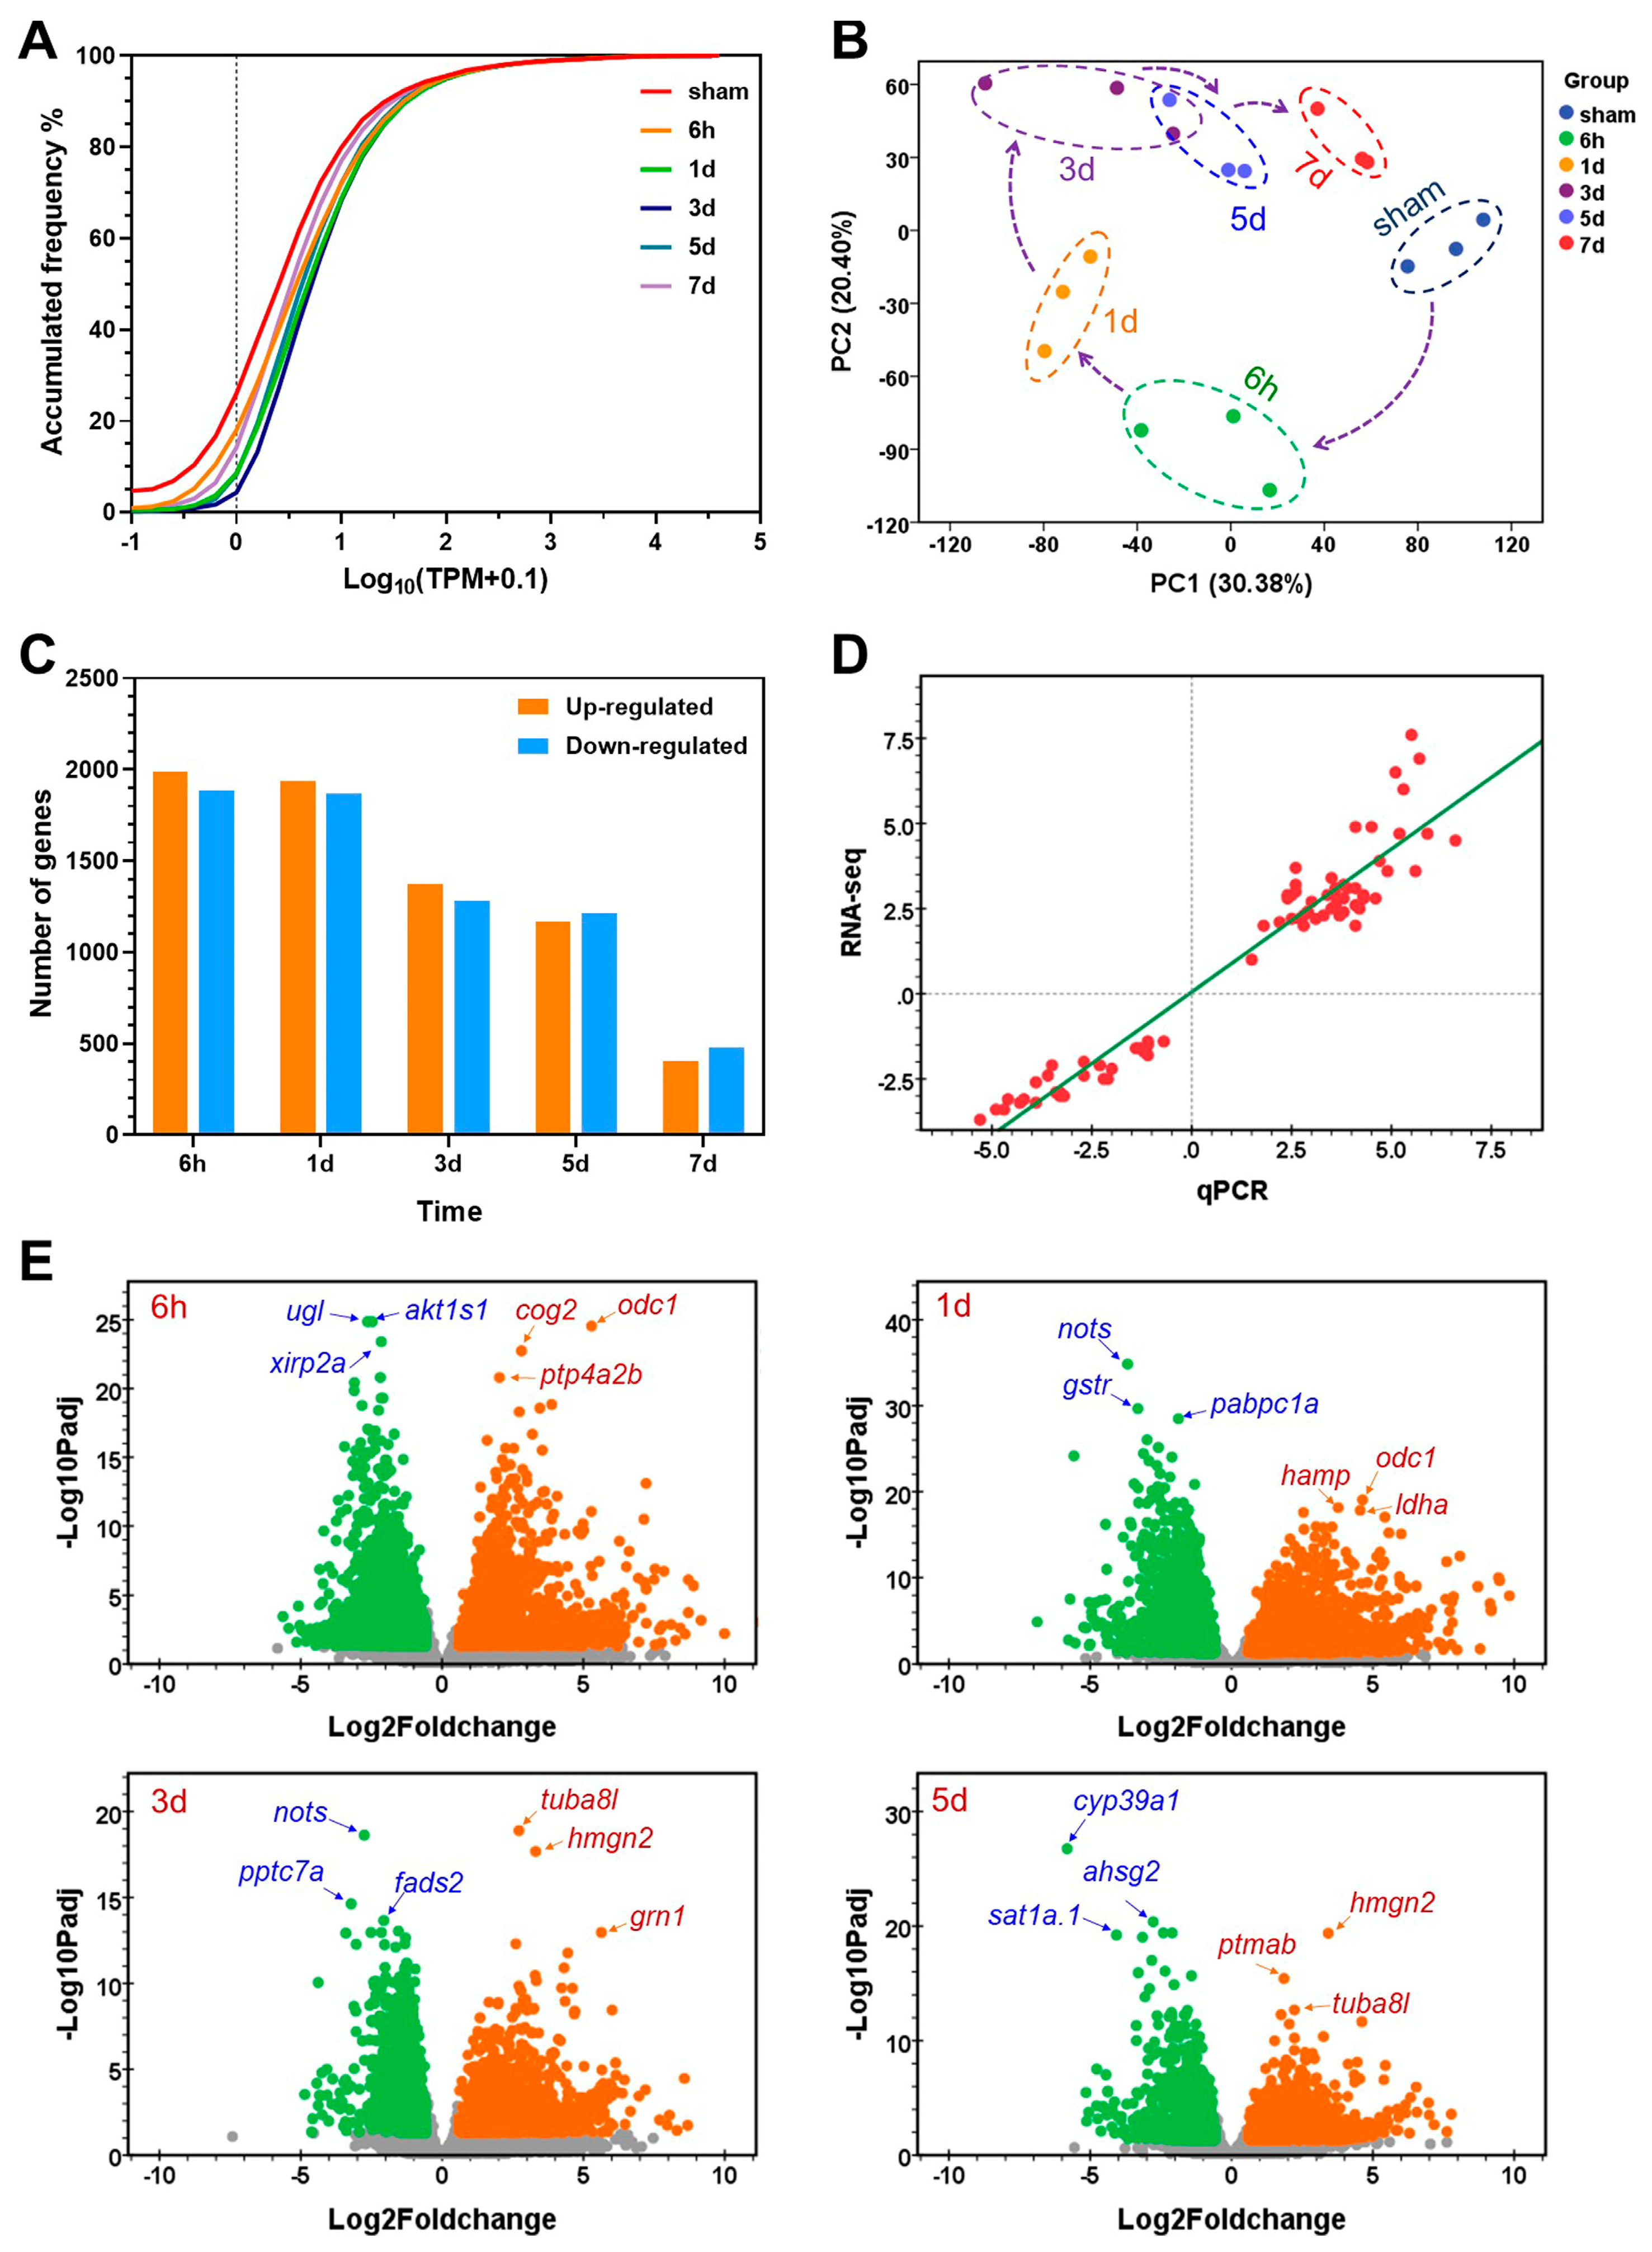
Fig. 2 Overall changes in gene expression after partial ventral lobe hepatectomy in zebrafish. (A) Frequency distribution of gene transcriptional abundance for the experimental groups. The dashed line indicates a cumulative ratio of the low abundance genes under the indicated conditions. (B) Principal component analysis of the gene abundance data. (C) Numbers of the up- and down-regulated genes at the indicated time points after the PHx surgery. (D) Correlation between the qPCR and RNA-seq data. (E) Volcano plots demonstrating the DEGs at different time points. Yellow, up-regulated; green, down-regulated; gray, unchanged. Names of the most significantly up- (red) and down-regulated (blue) genes are shown.