
Fig. 2
- ID
- ZDB-FIG-240715-34
- Publication
- Song et al., 2024 - Transcriptomic Characterization of Key Factors and Signaling Pathways for the Regeneration of Partially Hepatectomized Liver in Zebrafish
- Other Figures
- All Figure Page
- Back to All Figure Page
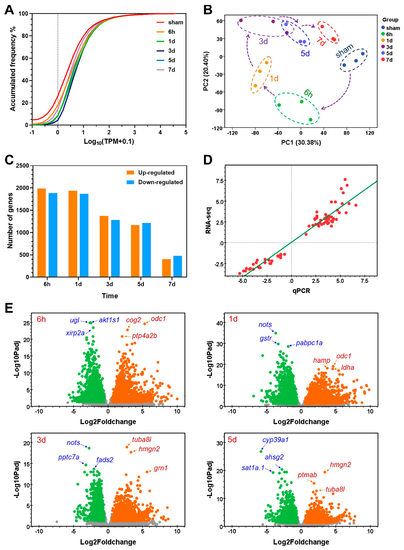
Overall changes in gene expression after partial ventral lobe hepatectomy in zebrafish. (A) Frequency distribution of gene transcriptional abundance for the experimental groups. The dashed line indicates a cumulative ratio of the low abundance genes under the indicated conditions. (B) Principal component analysis of the gene abundance data. (C) Numbers of the up- and down-regulated genes at the indicated time points after the PHx surgery. (D) Correlation between the qPCR and RNA-seq data. (E) Volcano plots demonstrating the DEGs at different time points. Yellow, up-regulated; green, down-regulated; gray, unchanged. Names of the most significantly up- (red) and down-regulated (blue) genes are shown. |