
- Title
-
Exposure to elevated glucocorticoid during development primes altered transcriptional responses to acute stress in adulthood
- Authors
- Choi, M.K., Cook, A., Mungikar, K., Eachus, H., Tochwin, A., Linke, M., Gerber, S., Ryu, S.
- Source
- Full text @ iScience
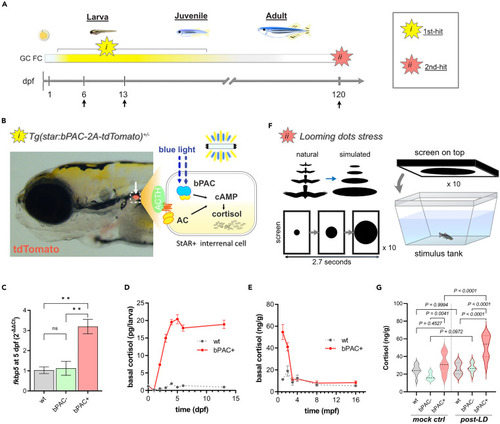
Double-hit stress model shows an elevation of cortisol during development and upon acute stress exposure in adulthood (A) A scheme illustrating the strategy underlying the double-hit zebrafish stress model which combines i) optogenetic cortisol elevation during development and ii) adulthood acute stress exposure. Arrows indicate sample collection times points for RNA-seq. (B) An image of Tg(star:bPAC-2A-tdTomato)ex300 larva at 5 dpf. The transgene is expressed solely in the interrenal gland (white arrow). A schematic drawing representing the intracellular events within the steroidogenic interrenal cells of the transgenic fish (dotted box). Endogenous GC production is stimulated by ACTH signaling. bPAC mimics ACTH signaling by increasing cAMP when exposed to blue light. (C) One of the well-known GR signaling markers, fkbp5, was significantly upregulated in bPAC+ larvae compared to bPAC- and wild-type control. ∗∗ = p < 0.01. Tukey’s multiple comparisons test following one-way ANOVA, F (2, 6) = 16.25, p = 0.0038. (D and E) Basal cortisol level at larval, juvenile, and adult stages (for animal numbers used in this experiment, see the STAR Methods). (F) A schematic drawing of the acute stress paradigm. Looming dots mimic approaching predators from above (Cook et al. 2023). (G) bPAC+ showed significantly higher cortisol levels following LD, compared to handling controls (no LD presented on the screen). n = 6 per group, Tukey’s multiple comparisons following one-way ANOVA; F(5, 54) = 19.31, p < 0.0001. Abbreviations: dpf: day post fertilization, mpf: month post fertilization, GC: glucocorticoid, ACTH: Adrenocorticotropic Hormone, AC: adenylyl cyclase, cAMP: Cyclic adenosine monophosphate, FC: fold change, LD: Looming dots, wt: wild type, ctrl: control, bPAC: beggiatoa photoactivated adenylyl cyclase. Error bars represent mean ± SEM. |
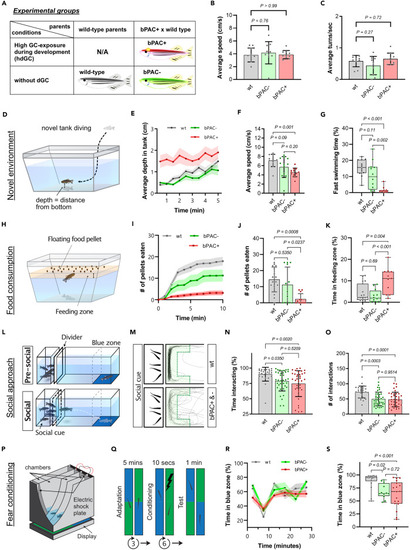
Altered behaviors in adult bPAC+ and bPAC- fish (A) A table depicting experimental groups. (B and C) No significant differences were observed in average speed nor turn frequency among wild type (wt), bPAC+, and bPAC-. Dunnett’s multiple comparisons followed one-way ANOVA, n = 10 per group. B) F(2, 27) = 0.2248, p=0.80; C) F(2, 27) = 2.332, p=0.12. (D) A schematic drawing for the novel tank test. (E) Average depth as measured by average distance from the bottom of the tank was greater for wt and bPAC- compared to bPAC+. (F and G) bPAC+ fish showed a slower average speed than wild type and reduced fast swimming bouts compared to bPAC- and wt, n = 12 per group. (H) A schematic drawing for the feeding behavior test. (I and J) bPAC+ consumed fewer number of pellets within 10 min compared to wt or bPAC-, n = 16 for wt, n = 12 for bPAC-, n = 12 for bPAC+. (K) bPAC+ spent more time near the food compared to wt or bPAC-, n = 16 for wt, n = 12 for bPAC-, n = 11 for bPAC+. (L) Schematic figures for the social behavior test. (M) Representative traces of wt, bPAC+, and bPAC- when conspecifics are visible. The green shaded area indicates the interaction zone where wildtype fish typically spend most of their time when conspecifics are visible. (N and O) During this social phase, bPAC+ and bPAC- showed a significantly reduced duration and frequency of social interactions compared to the wt (Cook et al., 2023), n = 26 for wt, n = 38 for bPAC-, n = 37 for bPAC+. (P) A schematic drawing for a chamber used for the fear conditioning test. (Q) An electric shock was given to subject fish when they swam in the green-colored area. After conditioning, time spent in each color zone was measured. (R) No significant difference was observed in color preference prior to fear conditioning. (S) bPAC+ showed reduced preference for the safe zone color (blue) after the conditioning using an electric shock, n = 18 for wt, n- = 18 for bPAC+, n = 12 for bPAC-. Error bars on bar graphs indicate the mean ± SD while shading in line graphs represents the mean ± SEM. Tukey’s multiple comparisons followed one-way ANOVA. F) F(2, 33) = 7.806, p=0.002; G) F(2, 33) = 17.31, p < 0.0001; J) F(2, 37) = 8.364, p=0.001; K) F(2, 36) = 9.120, p < 0.001, N) F(2, 98) = 6.273, p=0.0027; O) F(2, 98) = 10.93, p < 0.0001; S) F(2, 45) = 8.927, p < 0.001. |
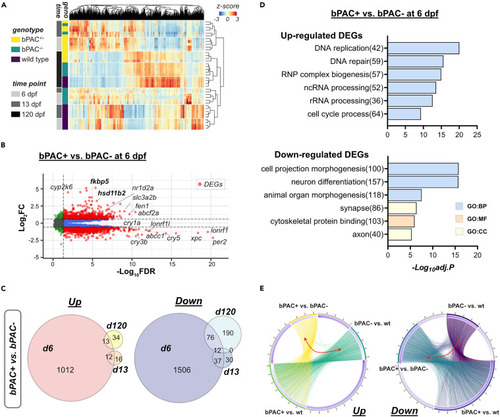
Developmental GC exposure leads to differential gene expressions across the life course (A) Read counts of genes by genotype and time points are represented by Z score in the heatmap. Bars on the left side indicate the genotype of fish (yellow: bPAC+, green: bPAC-, dark purple: wild type(wt)) and time points (gray: 6 dpf, dark gray: 13 dpf, black: 120 dpf). (B) Volcano plot showing DEGs (red dots) in bPAC+ and bPAC- brain transcriptome at 6 dpf. Dashed lines indicate FDR and FC cut-off values set at 0.05 and 1.5, respectively. Labels identify the genes associated with cortisol or circadian rhythm among the smallest FDR values. Plots for other time points and comparisons are available in Data S1. A complete list of identified DEGs is described in Table S1. (C) Venn Diagram for up- and down-regulated DEGs among wild type, bPAC- and bPAC+; criteria for DEG identification: |FC|>1.5 and FDR <0.05. (D) Top enriched GO terms for up- and down-regulated DEGs in bPAC+ compared to bPAC- at 6 dpf. A complete list of DEG-enriched GO terms is described in Table S2. (E) Circos plots showing overlapping DEGs by linked line among three pairwise comparisons, bPAC+ vs. bPAC-, bPAC+ vs. wt, bPAC- vs. wt. FDR: False discovery rate, GO: Gene ontology, adj.p: adjusted p-value. |
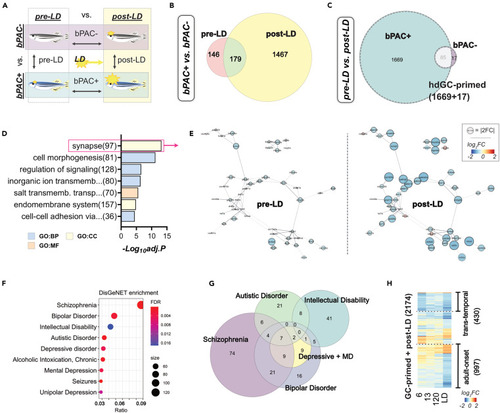
Developmental GC exposure primes differential gene expression following acute stress in bPAC+ adults (A) Schematic for three comparisons to identify transcriptional changes in response to LD exposure in adults. DEGs were determined by FC and FDR. |FC|>1.5 and FDR<0.05. (B) Venn diagram representing DEGs between bPAC+ and bPAC- in pre-LD and post-LD conditions. (C) Venn diagram showing post-LD DEGs from bPAC+ and bPAC-. The list of DEGs is described in Table S3. hdGC-primed genes are marked by a dashed line. (D) The top GO terms enriched in hdGC-primed genes. The enrichment score = -log10(adjusted p-value). (E) PPI networks of synapse-associated hdGC-primed genes. The size of the node indicates a fold-change. Networks sourced by STRING-db. (F) Result of human disorders enrichment test based on the DisGeNET database using GC-primed genes. The ratio represents overlapping/input genes. Top ranked disorders are Schizophrenia (FDR = 1.12e-04, ratio = 122/883), Bipolar Disorder (FDR = 2.47e-03, ratio = 69/477), Intellectual Disability (FDR = 1.71e-02, ratio = 61/447), Autistic Disorder (FDR = 1.87e-04, ratio = 48/261), Depressive disorder (FDR = 4.51e-03, ratio = 46/289), and Mental Depression (FDR = 4.06e-03, ratio = 42/254). The complete results are noted in Table S5. (G) Venn diagram for hdGC-primed genes that are associated with the top human psychiatric disorders in panel F. (H) Heatmap showing Log2FC of 2174 LD-DEGs across time points demonstrated 430 trans-temporal and 997 adult-onset genes were mostly downregulated. LD: looming dots, FC: fold change, FDR: False discovery rate, PPI: Protein-protein interaction, ratio: GC-primed genes/disease genes, Depressive + MD: Depressive disorder and Mental Depression. |
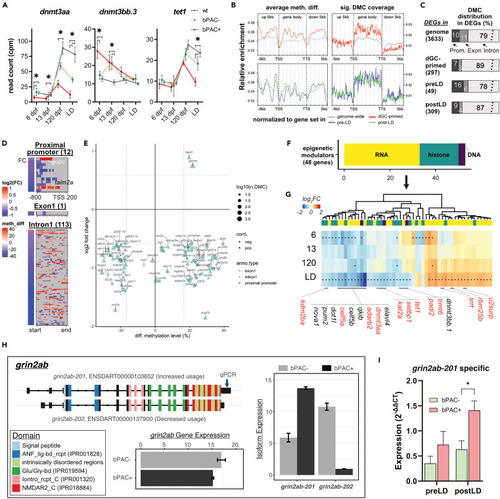
Subsets of GC-primed genes are differentially methylated and spliced in bPAC+ brains (A) Expression trajectories for differentially expressed dnmts in bPAC+ brains. Šídák’s multiple comparisons test followed mixed model ANOVA. The asterisks indicate the time points with significant differential expressions (adj.p < 0.05 and |FC| >1.5). dnmt3aa: F(6, 39) = 13.13, p < 0.0001; dnmt3bb.3: F(6, 39) = 11.26, p < 0.0001; tet1: F(6, 39) = 7.037, p < 0.0001. Error bars indicate mean ± SD. wt: wild type. (B) hdGC-primed genes showed a higher ratio of significant DMCs in their gene body regions. meth. diff: methylation level difference. (C) The bar graph depicts the percentage of DEGs, which have DMCs in their proximal promoter, exon, or intron. (D and E) Methylation levels of DMCs on the regulatory regions of genes including proximal promoter, exon1, and intron1 were positively or negatively correlated with subsets of GC-primed genes. (D) Heatmaps present gene expression foldchange and DMCs of genes. (E) x and y axis of the dot plot represent the average methylation level of DMCs in each regulatory region (color of dots), respectively. (F) Bar graph showing known epigenetic regulators associated with DNA (purple, 3 genes), RNA (yellow, 30 genes), and histone (dark green, 15 genes) modification or process among hdGC-primed genes and post-LD DEGs. (G) Heatmap represents log2FC of them. The asterisk in each cell refers to FDR <0.05. The red label indicates the existence of DMCs in their corresponding regions. (H) An example of identified differential usage of grin2ab transcript variants between bPAC+ vs. bPAC-. Color codes known protein domains. Expression values in bar plots are based on count per million (CPM). The Arrow on the transcript, grin2ab-201, indicates primer binding sites for qPCR. (I) Differential usage of the transcript, grin2ab-201, was validated by real-time qPCR. Error bars show mean + SEM. |