
Fig. 1
- ID
- ZDB-FIG-240711-25
- Publication
- Choi et al., 2024 - Exposure to elevated glucocorticoid during development primes altered transcriptional responses to acute stress in adulthood
- Other Figures
- All Figure Page
- Back to All Figure Page
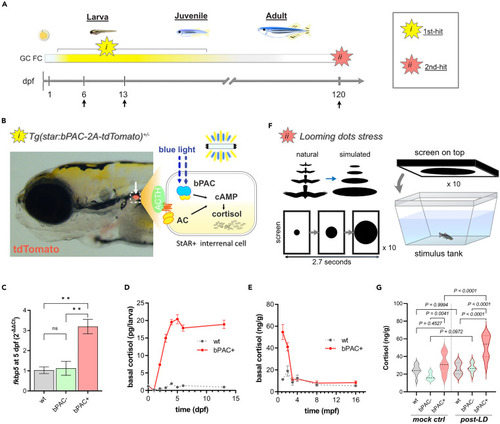
Double-hit stress model shows an elevation of cortisol during development and upon acute stress exposure in adulthood (A) A scheme illustrating the strategy underlying the double-hit zebrafish stress model which combines i) optogenetic cortisol elevation during development and ii) adulthood acute stress exposure. Arrows indicate sample collection times points for RNA-seq. (B) An image of Tg(star:bPAC-2A-tdTomato)ex300 larva at 5 dpf. The transgene is expressed solely in the interrenal gland (white arrow). A schematic drawing representing the intracellular events within the steroidogenic interrenal cells of the transgenic fish (dotted box). Endogenous GC production is stimulated by ACTH signaling. bPAC mimics ACTH signaling by increasing cAMP when exposed to blue light. (C) One of the well-known GR signaling markers, fkbp5, was significantly upregulated in bPAC+ larvae compared to bPAC- and wild-type control. ∗∗ = p < 0.01. Tukey’s multiple comparisons test following one-way ANOVA, F (2, 6) = 16.25, p = 0.0038. (D and E) Basal cortisol level at larval, juvenile, and adult stages (for animal numbers used in this experiment, see the STAR Methods). (F) A schematic drawing of the acute stress paradigm. Looming dots mimic approaching predators from above (Cook et al. 2023). (G) bPAC+ showed significantly higher cortisol levels following LD, compared to handling controls (no LD presented on the screen). n = 6 per group, Tukey’s multiple comparisons following one-way ANOVA; F(5, 54) = 19.31, p < 0.0001. Abbreviations: dpf: day post fertilization, mpf: month post fertilization, GC: glucocorticoid, ACTH: Adrenocorticotropic Hormone, AC: adenylyl cyclase, cAMP: Cyclic adenosine monophosphate, FC: fold change, LD: Looming dots, wt: wild type, ctrl: control, bPAC: beggiatoa photoactivated adenylyl cyclase. Error bars represent mean ± SEM. |