
|
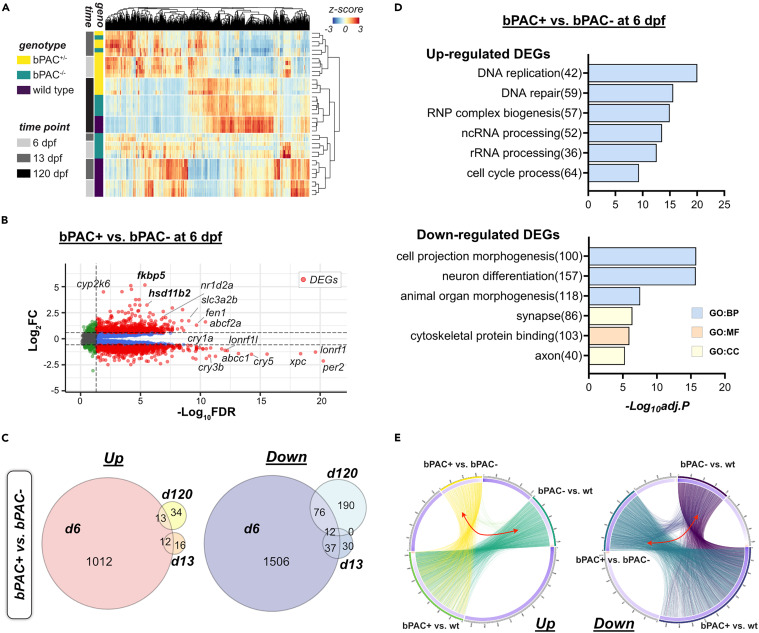
Fig. 3 Developmental GC exposure leads to differential gene expressions across the life course (A) Read counts of genes by genotype and time points are represented by Z score in the heatmap. Bars on the left side indicate the genotype of fish (yellow: bPAC+, green: bPAC-, dark purple: wild type(wt)) and time points (gray: 6 dpf, dark gray: 13 dpf, black: 120 dpf). (B) Volcano plot showing DEGs (red dots) in bPAC+ and bPAC- brain transcriptome at 6 dpf. Dashed lines indicate FDR and FC cut-off values set at 0.05 and 1.5, respectively. Labels identify the genes associated with cortisol or circadian rhythm among the smallest FDR values. Plots for other time points and comparisons are available in Data S1. A complete list of identified DEGs is described in Table S1. (C) Venn Diagram for up- and down-regulated DEGs among wild type, bPAC- and bPAC+; criteria for DEG identification: |FC|>1.5 and FDR <0.05. (D) Top enriched GO terms for up- and down-regulated DEGs in bPAC+ compared to bPAC- at 6 dpf. A complete list of DEG-enriched GO terms is described in Table S2. (E) Circos plots showing overlapping DEGs by linked line among three pairwise comparisons, bPAC+ vs. bPAC-, bPAC+ vs. wt, bPAC- vs. wt. FDR: False discovery rate, GO: Gene ontology, adj.p: adjusted p-value.