
Fig. 2
- ID
- ZDB-FIG-240711-26
- Publication
- Choi et al., 2024 - Exposure to elevated glucocorticoid during development primes altered transcriptional responses to acute stress in adulthood
- Other Figures
- All Figure Page
- Back to All Figure Page
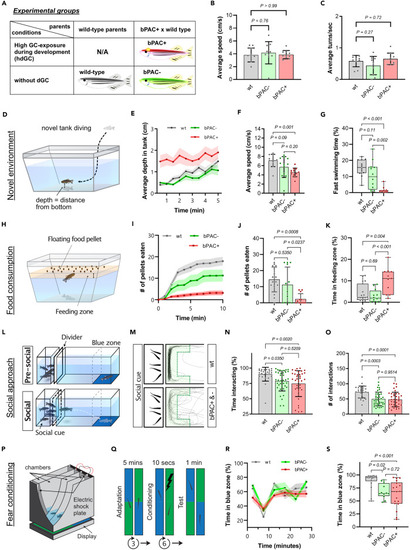
Altered behaviors in adult bPAC+ and bPAC- fish (A) A table depicting experimental groups. (B and C) No significant differences were observed in average speed nor turn frequency among wild type (wt), bPAC+, and bPAC-. Dunnett’s multiple comparisons followed one-way ANOVA, n = 10 per group. B) F(2, 27) = 0.2248, p=0.80; C) F(2, 27) = 2.332, p=0.12. (D) A schematic drawing for the novel tank test. (E) Average depth as measured by average distance from the bottom of the tank was greater for wt and bPAC- compared to bPAC+. (F and G) bPAC+ fish showed a slower average speed than wild type and reduced fast swimming bouts compared to bPAC- and wt, n = 12 per group. (H) A schematic drawing for the feeding behavior test. (I and J) bPAC+ consumed fewer number of pellets within 10 min compared to wt or bPAC-, n = 16 for wt, n = 12 for bPAC-, n = 12 for bPAC+. (K) bPAC+ spent more time near the food compared to wt or bPAC-, n = 16 for wt, n = 12 for bPAC-, n = 11 for bPAC+. (L) Schematic figures for the social behavior test. (M) Representative traces of wt, bPAC+, and bPAC- when conspecifics are visible. The green shaded area indicates the interaction zone where wildtype fish typically spend most of their time when conspecifics are visible. (N and O) During this social phase, bPAC+ and bPAC- showed a significantly reduced duration and frequency of social interactions compared to the wt (Cook et al., 2023), n = 26 for wt, n = 38 for bPAC-, n = 37 for bPAC+. (P) A schematic drawing for a chamber used for the fear conditioning test. (Q) An electric shock was given to subject fish when they swam in the green-colored area. After conditioning, time spent in each color zone was measured. (R) No significant difference was observed in color preference prior to fear conditioning. (S) bPAC+ showed reduced preference for the safe zone color (blue) after the conditioning using an electric shock, n = 18 for wt, n- = 18 for bPAC+, n = 12 for bPAC-. Error bars on bar graphs indicate the mean ± SD while shading in line graphs represents the mean ± SEM. Tukey’s multiple comparisons followed one-way ANOVA. F) F(2, 33) = 7.806, p=0.002; G) F(2, 33) = 17.31, p < 0.0001; J) F(2, 37) = 8.364, p=0.001; K) F(2, 36) = 9.120, p < 0.001, N) F(2, 98) = 6.273, p=0.0027; O) F(2, 98) = 10.93, p < 0.0001; S) F(2, 45) = 8.927, p < 0.001. |