
|
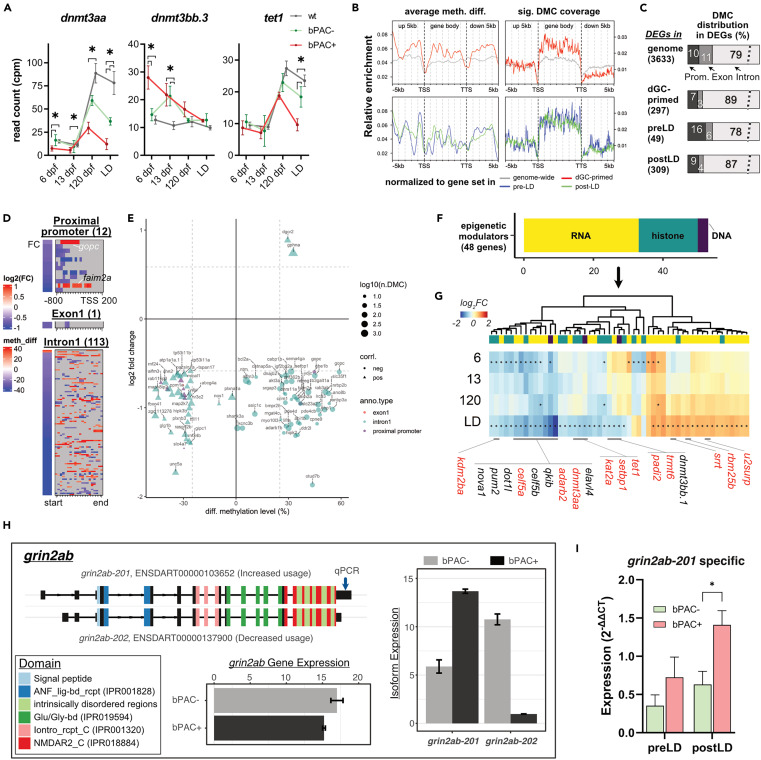
Fig. 5 Subsets of GC-primed genes are differentially methylated and spliced in bPAC+ brains (A) Expression trajectories for differentially expressed dnmts in bPAC+ brains. Šídák’s multiple comparisons test followed mixed model ANOVA. The asterisks indicate the time points with significant differential expressions (adj.p < 0.05 and |FC| >1.5). dnmt3aa: F(6, 39) = 13.13, p < 0.0001; dnmt3bb.3: F(6, 39) = 11.26, p < 0.0001; tet1: F(6, 39) = 7.037, p < 0.0001. Error bars indicate mean ± SD. wt: wild type. (B) hdGC-primed genes showed a higher ratio of significant DMCs in their gene body regions. meth. diff: methylation level difference. (C) The bar graph depicts the percentage of DEGs, which have DMCs in their proximal promoter, exon, or intron. (D and E) Methylation levels of DMCs on the regulatory regions of genes including proximal promoter, exon1, and intron1 were positively or negatively correlated with subsets of GC-primed genes. (D) Heatmaps present gene expression foldchange and DMCs of genes. (E) x and y axis of the dot plot represent the average methylation level of DMCs in each regulatory region (color of dots), respectively. (F) Bar graph showing known epigenetic regulators associated with DNA (purple, 3 genes), RNA (yellow, 30 genes), and histone (dark green, 15 genes) modification or process among hdGC-primed genes and post-LD DEGs. (G) Heatmap represents log2FC of them. The asterisk in each cell refers to FDR <0.05. The red label indicates the existence of DMCs in their corresponding regions. (H) An example of identified differential usage of grin2ab transcript variants between bPAC+ vs. bPAC-. Color codes known protein domains. Expression values in bar plots are based on count per million (CPM). The Arrow on the transcript, grin2ab-201, indicates primer binding sites for qPCR. (I) Differential usage of the transcript, grin2ab-201, was validated by real-time qPCR. Error bars show mean + SEM.