
- Title
-
Genome sequencing of Coryphaenoides yaquinae reveals convergent and lineage-specific molecular evolution in deep-sea adaptation
- Authors
- Li, W., Song, J., Tu, H., Jiang, S., Pan, B., Li, J., Zhao, Y., Chen, L., Xu, Q.
- Source
- Full text @ Mol. Ecol. Resources
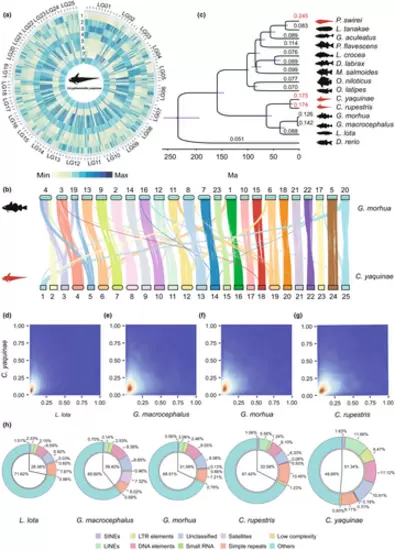
Genome assembly and evolutionary history for C. yaquinae. (a) The circos plot illustrates the distribution of genomic elements in C. yaquinae. Each segment of the plot corresponds to a window of 1 Mbp. Starting from the outer ring and moving towards the inner ring, the elements depicted are as follows: (1) Gene frequency, (2) Density of LINEs, (3) Density of LTRs, (4) Density of DNA, (5) Density of Simple Repeats, (6) Density of Low Complexity Sequences, (7) Density of SINEs and (8) Density of GC content. (b) The genomic collinearity between the chromosome-level genomes of C. yaquinae and G. morhua is shown. Each line corresponds to a syntenic block and is coloured based on C. yaquinae. (c) The genomic phylogeny displays the relationship between deep-sea fish and other relevant teleost lineages. Three deep-sea fish species are indicated by red silhouettes. The numbers above the branches indicate the dN/dS ratio, and the grey-shaded areas at each node represent the divergence time. The branch lengths are proportional to the divergence times. (d–g) The two-dimensional kernel density distribution shows the dN/dS (ω value) in four different comparisons: (d) C. yaquinae vs L. lota, (e) C. yaquinae vs G. macrocephalus, (f) C. yaquinae vs G. morhua and (g) C. yaquinae vs C. rupestris. (h) The percentage of repetitive elements in the five genomes within the order Gadiformes. |
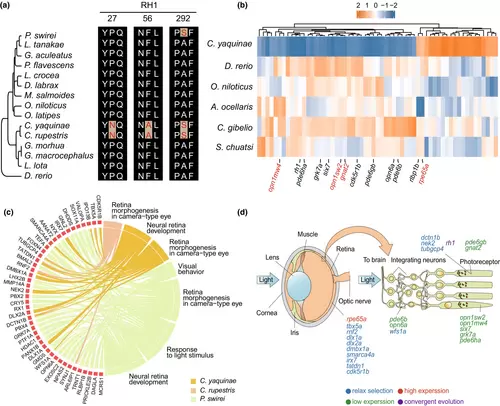
Alterations in vision-related genes in C. yaquinae. (a) Convergent evolution of RH1, with converging evolutionary sites highlighted in red. (b) Expression profile of vision-related genes in the eyes of C. yaquinae and other species. (c) The chord plot illustrates relaxation selection associated with visual Gene Ontology (GO) terms. The chords display the detailed relationship between relaxed genes (left semicircle) and their enriched GO terms (right semicircle). Three different colours represent three species. (d) Schematic depiction of gene expression in the eye. |
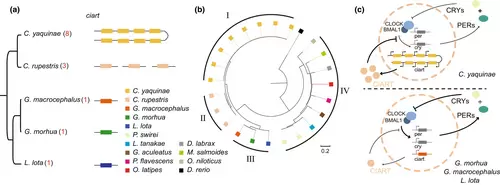
Ciarta gene duplication in C. yaquinae. (a) Phylogenetic tree and replication status of ciart in cod fish. C. yaquinae exhibits a unique and continuous tandem replication of eight copies, while C. rupestris, which has a closer evolutionary relationship to C. yaquinae, has three copies. The other three species have only a single copy. (b) Phylogenetic tree showing the relationship of 24 ciart genes among C. yaquinae, C. rupestris and 12 other species. (c) Pattern of CIART involvement in the TTFL (transcription–translation feedback loop) in C. yaquinae (above) and other Gadiformes fish species (below). The eight-fold tandem replication of ciart in C. yaquinae significantly impacts the TTFL pathway, compared to the single copy found in G. morhua, G. macrocephalus and L. lota. |
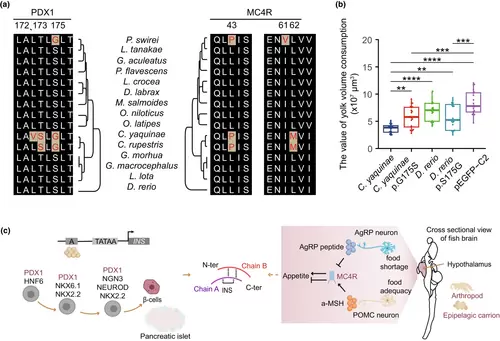
PDX1 and MC4R energy metabolism regulation. (a) Comparison of convergent amino acid substitutions in the PDX1 and MC4R genes across 15 fish genomes. (b) Functional verification of the convergence site in PDX1. Plasmids containing fixed point mutations in the PDX1 gene were injected into fish eggs, and the consumption of yolk was calculated (n = 20). Analysis was performed using ANOVA, and the resulting p-value is denoted as (*p-value < .05, **p-value < .01, *** p-value < .001, ****p-value < .0001). (c) PDX1 and MC4R genes are involved in insulin (INS) regulation. |
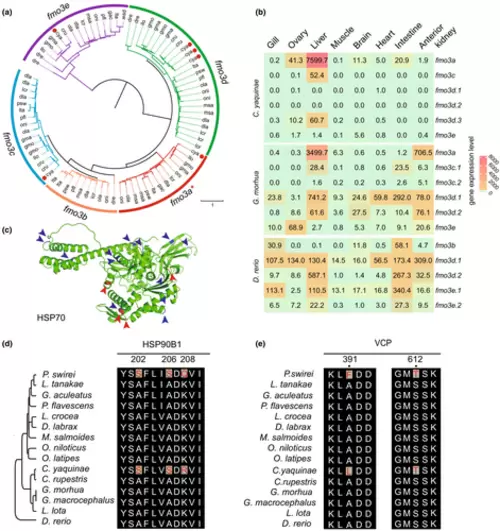
Genetic innovations associated with the adaptation of hydrostatic pressure. (a) Phylogeny of the TMAO-generating enzyme flavin monooxygenase 3 in 15 teleosts. The red dots represent the fmo3 gene in C. yaquinae. The gene nomenclature for the fmo3 gene family follows Wang et al. (2019). (b) The evolution of fmo3 gene expression in three fish species explains the reduction in multiplicity. (c) Three-dimensional views of the HSP70, highlighting deep-sea cod (blue arrow) and rough abyssal grenadier (red arrow) specific amino acid substitutions. (d) The HSP90B1 has an A202S and an A206S convergent AA replacement in abyssal–hadal and hadal fish, which is conserved among teleosts. Additionally, a K208Q and a K208R are shown in P. swirei and C. yaquinae, respectively. (e) The VCP has an S612T convergent AA replacement in abyssal–hadal and hadal fish. Additionally, an A391F and an A391L are shown in P. swirei and C. yaquinae, respectively. |