
Fig. 1
- ID
- ZDB-FIG-240731-35
- Publication
- Li et al., 2024 - Genome sequencing of Coryphaenoides yaquinae reveals convergent and lineage-specific molecular evolution in deep-sea adaptation
- Other Figures
- All Figure Page
- Back to All Figure Page
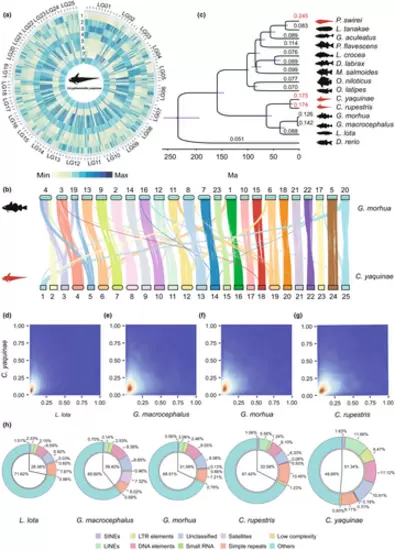
Genome assembly and evolutionary history for C. yaquinae. (a) The circos plot illustrates the distribution of genomic elements in C. yaquinae. Each segment of the plot corresponds to a window of 1 Mbp. Starting from the outer ring and moving towards the inner ring, the elements depicted are as follows: (1) Gene frequency, (2) Density of LINEs, (3) Density of LTRs, (4) Density of DNA, (5) Density of Simple Repeats, (6) Density of Low Complexity Sequences, (7) Density of SINEs and (8) Density of GC content. (b) The genomic collinearity between the chromosome-level genomes of C. yaquinae and G. morhua is shown. Each line corresponds to a syntenic block and is coloured based on C. yaquinae. (c) The genomic phylogeny displays the relationship between deep-sea fish and other relevant teleost lineages. Three deep-sea fish species are indicated by red silhouettes. The numbers above the branches indicate the dN/dS ratio, and the grey-shaded areas at each node represent the divergence time. The branch lengths are proportional to the divergence times. (d–g) The two-dimensional kernel density distribution shows the dN/dS (ω value) in four different comparisons: (d) C. yaquinae vs L. lota, (e) C. yaquinae vs G. macrocephalus, (f) C. yaquinae vs G. morhua and (g) C. yaquinae vs C. rupestris. (h) The percentage of repetitive elements in the five genomes within the order Gadiformes. |