FIGURE SUMMARY
Title

Lactate secreted by glycolytic conjunctival melanoma cells attracts and polarizes macrophages to drive angiogenesis in zebrafish xenografts

Authors
Yin, J., Forn-Cuní, G., Surendran, A.M., Lopes-Bastos, B., Pouliopoulou, N., Jager, M.J., Le Dévédec, S.E., Chen, Q., Snaar-Jagalska, B.E.
Source
Full text @ Angiogenesis

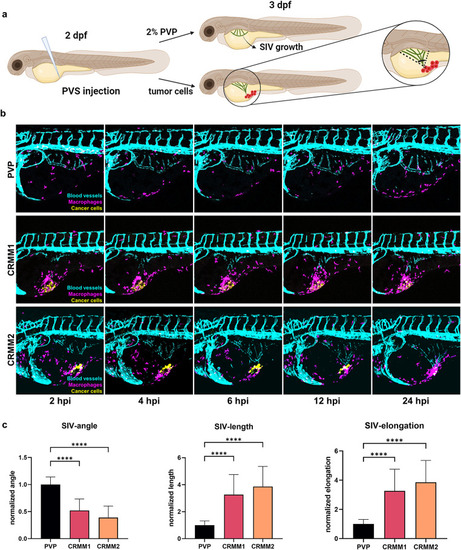
Metastatic conjunctival melanoma cells induce angiogenesis and recruitment of macrophages in a zebrafish angiogenesis model. a Schematic representation of the angiogenesis assay in zebrafish xenografts. Cancer cells or 2% PVP used as vehicle are injected into the PVS at 2 day post fertilization (dpf) zebrafish larvae Tg(kdrl:EGFPs843; mpeg1:GAL4-VP16gl24; UAS-E1b: NfsB-mCherryi149). In response to a strong angiogenic signal, the SIV complex is deformed towards the injection focus. b Representative images of time-lapses recording the angiogenic response to the SIV from 2 to 24 hpi. c Quantifications of the angiogenic activity induced by engraftment of CoM cells at 24hpi as measured by the angle, total length, and elongation of the SIV complex

Chemical ablation of macrophages inhibits tumor-induced angiogenesis in a zebrafish model. a Representative images of xenografted zebrafish larvae, treated with or without 2.5mM MTZ at 24hpi. b Quantification of the angiogenic capacity of cancer cells with and without macrophages. c Xenografted zebrafish material was retrieved and used to detect angiogenetic and inflammatory factors with qPCR. d Expression levels of zebrafish VEGF-A (vegfaa), TGF-β (tgfb1a), and IL-10 (il10) in CRMM1 and CRMM2 engrafted groups. e Expression of the M2 marker IL-4 (il4) in tumor engrafted zebrafish treated with DMSO and MTZ. f Expression of proinflammatory markers, iNOS (nos2a), IL-1β (il1b), and TNF-α (tnfa) in DMSO or MTZ-treated groups

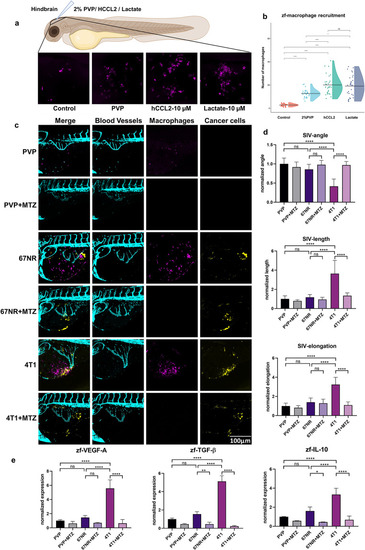
Lactate and glycolytic 4T1 cells attract zebrafish macrophages. a Schematic diagram of injection of lactate and hCCL2 into the zebrafish hindbrain. b Quantification of the macrophages attracted to the hindbrain under different conditions. c Representative images of the angiogenic effect in the SIV complex with and without treatment with MTZ at 24 hpi. d Quantification of the angiogenic influence of the 67NR and 4T1 cell lines with and without macrophages. e Expression of the zebrafish-derived proangiogenic markers VEGF-A (vegfaa), TGF-β (tgfb1a), and IL-10 (il10)

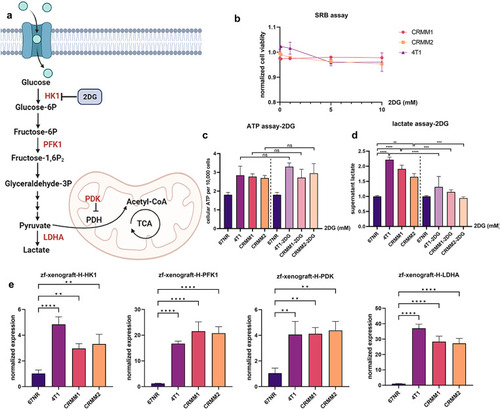
CoM cells secrete lactate and maintain their glycolytic properties in xenograft models. a Schematic representation of the glycolysis pathway with key enzymes in the process, showing the effect of 2DG inhibiting the activity of Hexokinase 1 (HK1). b Quantification of cell viability during treatment of increasing 2DG concentrations for 24 h. c The cellular ATP level of 67NR and 4T1, CRMM1, and CRMM2 after 2DG treatment. d 2DG inhibited the lactate production in 67NR and 4T1, CRMM1, and CRMM2 cells. e Expression of the glycolysis-related enzymes HK1, PFK1, PDK, and LDHA in zebrafish 4T1, 67NR, CRMM1 and CRMM2 xenografts

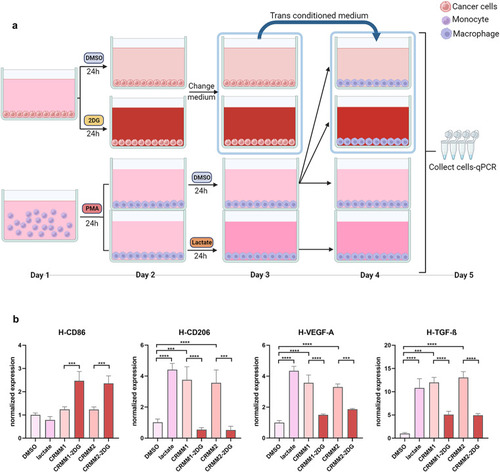
Supernatant secreted by CoM cells polarizes macrophages to an M2-like phenotype leading to higher expression of proangiogenic factors. a Schematic diagram of the conditioned medium experimental design. b Expression of CD86, CD206, VEGF-A, and TGF-β of macrophages in conditioned medium models

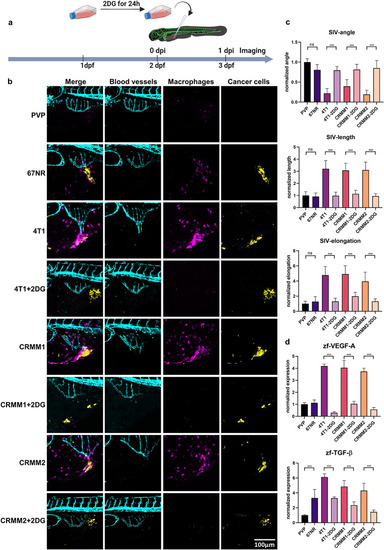
Inhibition of glycolysis attenuates macrophage-dependent angiogenesis of CoM cells. a Schematic diagram of 2DG treatment in cancer cells prior to their xenografting in zebrafish larvae. b Representative images of the angiogenesis response of embryos xenografted with CoM lines treated with and without 2DG treatment. c Quantification of the angiogenesis response in these conditions. d Quantification of the pro-angiogenic factors VEGF-A (vegfaa) and TGF-β (tgfb1a) in engrafted zebrafish

Acknowledgments
This image is the copyrighted work of the attributed author or publisher, and ZFIN has permission only to display this image to its users. Additional permissions should be obtained from the applicable author or publisher of the image. Full text @ Angiogenesis