Otoprotection against various ototoxin-induced lateral line neuromast damage by inhibitors of different cell death pathways. Typical confocal images and quantitative results of otoprotection assay. (A) The ferroptosis inhibitor Liproxstatin-1 effectively blocks neomycin-induced hair cell death. The non-specific antioxidant NAC shows partial protective activity while apoptosis inhibitor (Z-VAD-FMK) and necroptosis inhibitor (Necrostatin-1) are not effective in this assay. (B) Liproxstatin-1 and NAC also partially protect against streptomycin-induced hair cell death. (C, D) Gentamicin- or amikacin-induced hair cell death can be partially protected by Liproxstatin-1, Z-VAD-FMK, Necrostatin-1, or NAC. (E) Cisplatin-induced hair cell damage is ameliorated by Z-VAD-FMK, Necrostatin-1, NAC but not Liproxstatin-1. (F) Copper-induce hair cell death is protected by Necrostatin-1 or NAC, but not Liproxstatin-1 or Z-VAD-FMK. Three biological repeats were performed for each assay and at least ten larvae were analyzed for each treatment. Data represent mean ± s.d. and p-value is determined by ordinary one-way ANOVA with Dunnett’s multiple comparisons test. ns, no significance; *, p < 0.05; **, p < 0.01; ***, p < 0.001. Scale bar in A-F: 20 μm

ROS staining in hair cells. Representative confocal images of DCF staining (A, for total ROS) or Liperfluo staining (B, for lipid ROS) are shown. Neomycin induces the accumulation of total ROS as well as lipid ROS, which can be blocked by Liprosxstatin-1 and NAC, but not Z-VAD-FMK and Necrostatin-1. Assays were repeated twice. Scale bar in A-B: 20 μm

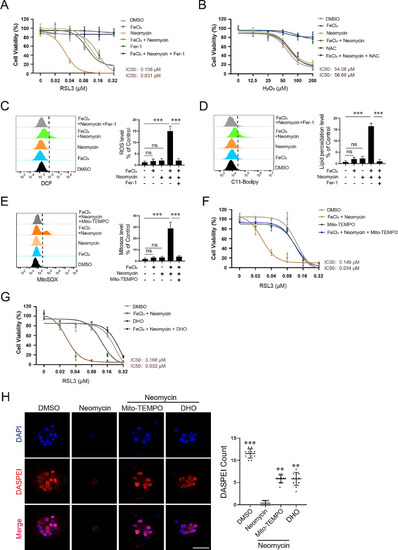
Neomycin and Fe3+synergistically sensitize HT1080 cells to ferroptosis inducer RSL3. (A) Cell viability assay. Neomycin (500 µM) or Fe3+ iron (5 µM) treatment alone has minor effect on ferroptosis sensitivity to RSL3, however, a combination of them dramatically sensitizes HT1080 cells to RSL3-induced ferroptosis. Data represent mean ± s.d. from three independent experiments. (B) Neomycin, iron or their combination does not sensitize HT1080 cells to H2O2-induced cell death. Assays were performed and data were analyzed as described in (A). (C, D) FACS analysis of total ROS (C, DCF staining) or lipid ROS (D, C11-Bodipy staining) in the treated cells. Neomycin and iron synergistically induce total ROS as well as lipid ROS (in the absence of RSL3), which can be blocked by the ferroptosis inhibitor Fer-1 which is an RTA. Data represent mean ± s.d. from three biological repeats and p-value is determined by ordinary one-way ANOVA with Tukey’s multiple comparisons test. ns, no significance; ***, p < 0.001. (E) Neomycin and iron synergistically induce mitochondrial ROS (MitoSOX staining) which is blocked by the mitochondria-targeted antioxidant Mito-TEMPO. Data represent mean ± s.d. from three biological repeats and p-value is determined by ordinary one-way ANOVA with Tukey’s multiple comparisons test. ns, no significance; ***, p < 0.001. (F) Mito-TEMPO (20 µM) reverses ferroptosis sensitivity to RSL3 in HT1080 cells stimulated by the combination of neomycin and iron. Data represent mean ± s.d. from three independent experiments. (G) The neomycin/iron stimulated ferroptosis sensitivity to RSL3 is abolished by DHO treatment (200 µM), which activates the mitochondrial DHODH/CoQ pathway to defense against ferroptosis. Data represent mean ± s.d. from three biological repeats. (H) Mito-TEMPO (20 µM) or DHO (200 µM) partially alleviates neomycin-induced hair cell death. Data represent mean ± s.d. and p-value is determined by ordinary one-way ANOVA with Dunnett’s multiple comparisons test. **, p < 0.01; ***, p < 0.001. Scale bar: 20 μm

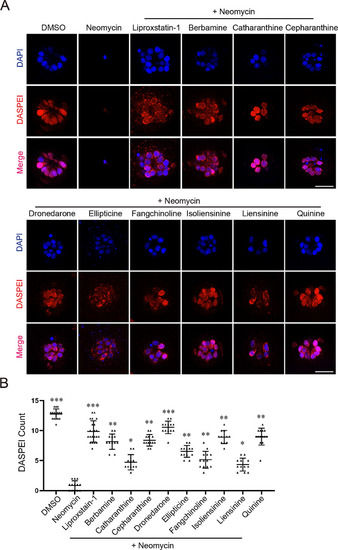
Otoprotection screening against neomycin-induced hair cell damage in zebrafish lateral line. A Representative otoprotection results of the nine positive hit compounds identified from our screen. Liperoxstatin-1 is a positive control. Scale bar: 20 μm. (B) Quantitative results for (A). Three biological repeats were performed and at least 10 larvae were analyzed for each treatment. p-value is determined by ordinary one-way ANOVA with Dunnett’s multiple comparisons test. *, p < 0.05; **, p < 0.01; ***, p < 0.001

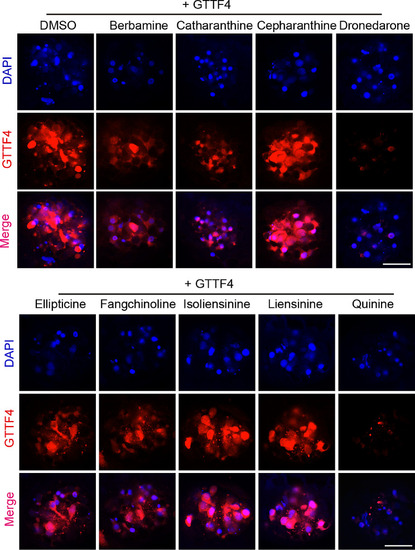
Dronedarone and quinine block the uptake of GTTF4. GTTF4 loading assay were performed to evaluate the ability of a testing compound to block the uptake of GTTF4 in hair cells. Assays were repeated twice, and representative images are shown here. Scale bar: 20 μm

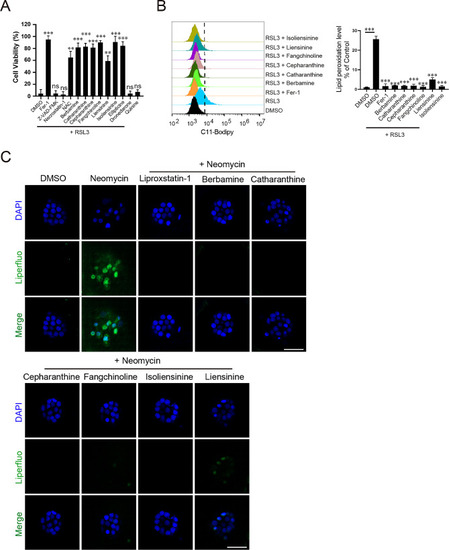
Multiple hit compounds inhibit lipid ROS accumulation and ferroptosis. A All hit compounds other than dronedarone and quinine are able to inhibit RSL3-induced ferroptosis in HT1080 cells. Data represent mean ± s.d. from three biological repeats and p-value is determined by ordinary one-way ANOVA with Dunnett’s multiple comparisons test. ns, no significance; **, p < 0.01; ***, p < 0.001. (B) FACS analysis of RSL3-induced lipid ROS in cells pretreated with a hit compound. Data represent mean ± s.d. from three biological repeats and p-value is determined by ordinary one-way ANOVA with Dunnett’s multiple comparisons test. ***, p < 0.001. (C) Hit compounds inhibit neomycin-induced lipid ROS accumulation in hair cells. Assays were performed and analyzed as described in Fig. 2B. Scale bar: 20 μm

Ellipticine inhibits ferroptosis by downregulation of TFRC and iron homeostasis. A Ellipticine toxicity assay in HT1080 cells. Data represent mean ± s.d. from three biological repeats. (B) Protection of RSL3-induced cell death by the indicated concentrations of ellipticine. The best protection is achieved at 0.5 µM. Data represent mean ± s.d. from three repeats and p-value is determined by ordinary one-way ANOVA with Dunnett’s multiple comparisons test. ns, no significance; *, p < 0.05; **, p < 0.01; ***, p < 0.001. (C) Ellipticine (0.5 µM) protects neomycin/ Fe3+ stimulated ferroptosis sensitivity to RSL3. Assays were performed as described in Fig. 3A and data represent mean ± s.d. from three biological repeats. (D) Ellipticine protects RSL3-induced (2 µM) ferroptosis, but not hydrogen peroxide-induced (100 µM) necroptosis or staurosporine-induced (2 µM) apoptosis in HT1080 cells. Data represent mean ± s.d. from three independent repeats and p-value is determined by ordinary one-way ANOVA with Tukey’s multiple comparisons test. ns, no significance; ***, p < 0.001. (E) In vitro DPPH assay for ROS scavenging activity. Data represent mean ± s.d. from three repeats and p-value is determined by ordinary one-way ANOVA with Dunnett’s multiple comparisons test. ns, no significance; **, p < 0.01; ***, p < 0.001. (F) Western blot for the indicated ferroptosis related proteins. The concentration used is 0.5 µM (for ellipticine) or 5 µM (for all other ferroptosis inhibiting compounds). GAPDH is the loading control. Assays were repeated twice, and representative blots are presented. (G) Ellipticine dose-dependently downregulates TFRC in either absence or presence of RSL3 in HT1080 cells. Representative western blots and quantitative results are presented. Data represent mean ± s.d. of 4 blots and p-value is determined by ordinary one-way ANOVA with Dunnett’s multiple comparisons test. *, p < 0.05; **, p < 0.01; ***, p < 0.001. (H) qRT-PCR analysis for TFRC and FTH1 gene expression in HT1080 cells. β-actin is the internal control. Data represent mean ± s.d. of three independent repeats and p-value is determined by student’s t-test. ns, no significance; *, p < 0.05. (I) Cell iron content assay in HT1080 cells. Data represent mean ± s.d. of three independent assays and p-value is determined by student’s t-test. *, p < 0.05. (J) qRT-PCR analysis for zebrafish tfr1a, tfr1b and fth1a gene expression. β-actin is the internal control. Data represent mean ± s.d. of three independent repeats and p-value is determined by ordinary one-way ANOVA with Dunnett’s multiple comparisons test. ns, no significance; *, p < 0.05; **, p < 0.01. (K) Western blot for transferrin receptor expression in zebrafish total embryonic lysate. β-Actin is the loading control. A representative blot and quantitative results are presented. Data represent mean ± s.d. of 3 blots and p-value is determined by ordinary one-way ANOVA with Dunnett’s multiple comparisons test. *, p < 0.05; **, p < 0.01

Acknowledgments
This image is the copyrighted work of the attributed author or publisher, and ZFIN has permission only to display this image to its users. Additional permissions should be obtained from the applicable author or publisher of the image. Full text @ Cell Biosci.