IMAGE

Fig. 7

ID
ZDB-IMAGE-240607-110
Source
Figures for Fan et al., 2024
Image
Figure Caption

Fig. 7

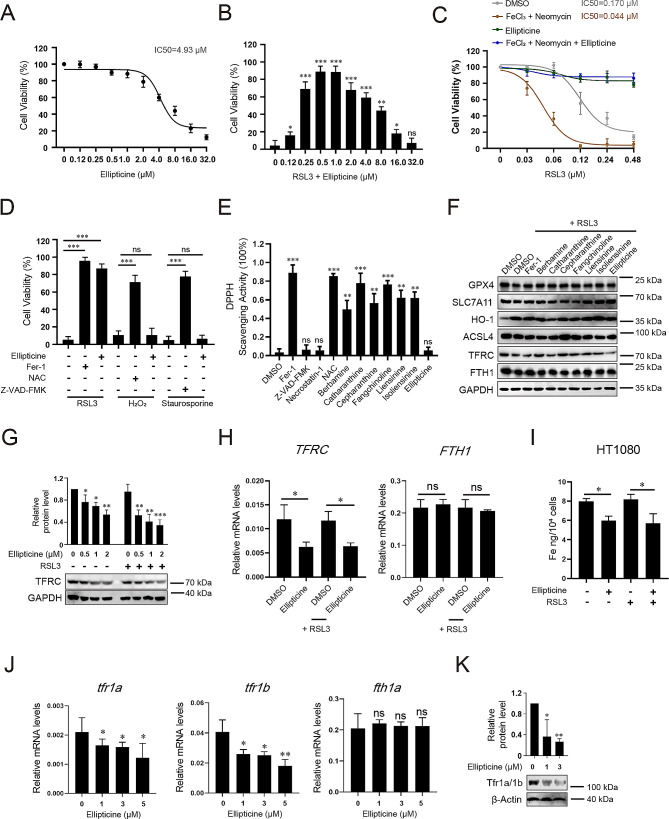
Ellipticine inhibits ferroptosis by downregulation of TFRC and iron homeostasis. A Ellipticine toxicity assay in HT1080 cells. Data represent mean ± s.d. from three biological repeats. (B) Protection of RSL3-induced cell death by the indicated concentrations of ellipticine. The best protection is achieved at 0.5 µM. Data represent mean ± s.d. from three repeats and p-value is determined by ordinary one-way ANOVA with Dunnett’s multiple comparisons test. ns, no significance; *, p < 0.05; **, p < 0.01; ***, p < 0.001. (C) Ellipticine (0.5 µM) protects neomycin/ Fe3+ stimulated ferroptosis sensitivity to RSL3. Assays were performed as described in Fig. 3A and data represent mean ± s.d. from three biological repeats. (D) Ellipticine protects RSL3-induced (2 µM) ferroptosis, but not hydrogen peroxide-induced (100 µM) necroptosis or staurosporine-induced (2 µM) apoptosis in HT1080 cells. Data represent mean ± s.d. from three independent repeats and p-value is determined by ordinary one-way ANOVA with Tukey’s multiple comparisons test. ns, no significance; ***, p < 0.001. (E) In vitro DPPH assay for ROS scavenging activity. Data represent mean ± s.d. from three repeats and p-value is determined by ordinary one-way ANOVA with Dunnett’s multiple comparisons test. ns, no significance; **, p < 0.01; ***, p < 0.001. (F) Western blot for the indicated ferroptosis related proteins. The concentration used is 0.5 µM (for ellipticine) or 5 µM (for all other ferroptosis inhibiting compounds). GAPDH is the loading control. Assays were repeated twice, and representative blots are presented. (G) Ellipticine dose-dependently downregulates TFRC in either absence or presence of RSL3 in HT1080 cells. Representative western blots and quantitative results are presented. Data represent mean ± s.d. of 4 blots and p-value is determined by ordinary one-way ANOVA with Dunnett’s multiple comparisons test. *, p < 0.05; **, p < 0.01; ***, p < 0.001. (H) qRT-PCR analysis for TFRC and FTH1 gene expression in HT1080 cells. β-actin is the internal control. Data represent mean ± s.d. of three independent repeats and p-value is determined by student’s t-test. ns, no significance; *, p < 0.05. (I) Cell iron content assay in HT1080 cells. Data represent mean ± s.d. of three independent assays and p-value is determined by student’s t-test. *, p < 0.05. (J) qRT-PCR analysis for zebrafish tfr1a, tfr1b and fth1a gene expression. β-actin is the internal control. Data represent mean ± s.d. of three independent repeats and p-value is determined by ordinary one-way ANOVA with Dunnett’s multiple comparisons test. ns, no significance; *, p < 0.05; **, p < 0.01. (K) Western blot for transferrin receptor expression in zebrafish total embryonic lysate. β-Actin is the loading control. A representative blot and quantitative results are presented. Data represent mean ± s.d. of 3 blots and p-value is determined by ordinary one-way ANOVA with Dunnett’s multiple comparisons test. *, p < 0.05; **, p < 0.01

Acknowledgments
This image is the copyrighted work of the attributed author or publisher, and ZFIN has permission only to display this image to its users. Additional permissions should be obtained from the applicable author or publisher of the image. Full text @ Cell Biosci.