
- Title
-
Targeting the interaction of pleiotrophin and VEGFA165 with protein tyrosine phosphatase receptor zeta 1 inhibits endothelial cell activation and angiogenesis
- Authors
- Choleva, E., Menounou, L., Ntenekou, D., Kastana, P., Tzoupis, Η., Katraki-Pavlou, S., Drakopoulou, M., Spyropoulos, D., Andrikopoulou, A., Kanellopoulou, V., Enake, M.K., Beis, D., Papadimitriou, E.
- Source
- Full text @ Eur. J. Pharmacol.
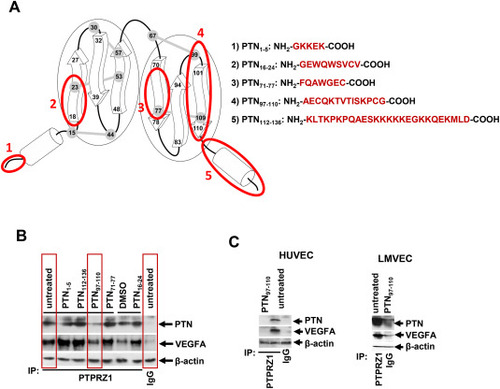
PTN97–110 inhibits the interaction of PTN and VEGFA with PTPRZ1. (A) Schematic representation of the domains that correspond to the studied PTN peptides on the tertiary structure of the PTN protein. The arrows represent the β-sheet domains, and the cylinders represent the random coils at the N- and C-terminal PTN domains. The five disulfide bonds on the PTN molecule are marked as grey. The numbers correspond to the respective amino acids of the secreted protein. The exact amino acid sequences of the PTN peptides tested in the present study are shown at the right. (B) C6 cells were cultured for 24 h in the presence of the tested peptides (100 ng/ml in the culture medium). Total cell lysates were then immunoprecipitated by using an antibody against PTPRZ1 or non-specific IgG and analyzed by Western blot using an antibody against PTN or VEGFA. The content of β-actin in the corresponding lysate was used as a loading control. Representative images from two independent experiments are shown. (C) HUVEC or LMVEC were incubated in the presence or absence of PTN97-110 (100 ng/ml) for 24 h. Total cell lysates were then immunoprecipitated by using an antibody against PTPRZ1 or non-specific IgG and analyzed by Western blot using an antibody against PTN or VEGFA. The content of β-actin in the corresponding lysate was used as a loading control. Representative images from two independent experiments are shown. |
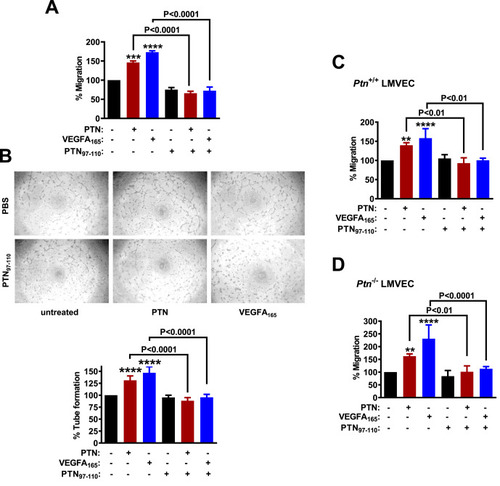
PTN97–110 inhibits PTN- and VEGFA165-induced endothelial cell migration and tube formation on Matrigel (A) Migration of HUVEC in the presence or absence of PTN (100 ng/ml), VEGFA165 (10 ng/ml) and/or PTN97-110 (100 ng/ml). Results are expressed as mean ± SD (n ≥ 4) of the percent number of migrated cells compared to the untreated cells (set as default 100%). (B) Representative photos and quantification of the tube network formed by HUVEC on Matrigel, in the presence or absence of PTN, VEGFA165, and/or PTN97-110. Results are expressed as mean ± SD (n = 5) of the percent total tube length compared to the untreated cells (set as default 100%). (C) Migration of Ptn+/+ and (D) Ptn−/− LMVEC in the presence or absence of PTN, VEGFA165, and/or PTN97-110. Results in C and D are expressed as mean ± SD (n ≥ 3) of the percent number of migrated cells compared to the corresponding untreated cells (set as default 100%). Asterisks denote statistical significance compared to the untreated cells. **P < 0.01, ***P < 0.001, ****P < 0.0001. |
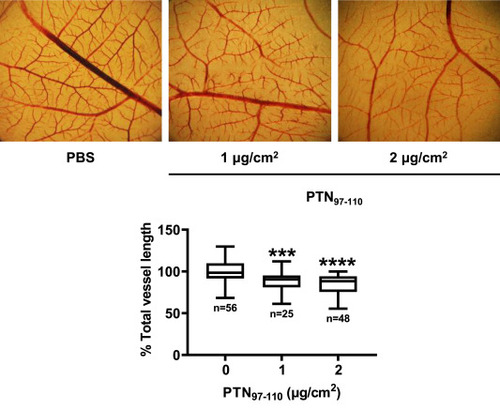
PTN97–110 inhibits chick embryo CAM angiogenesis. Different amounts of the peptide were applied to the CAM and 48 h later, the total vessel length was estimated using image analysis software. Results are expressed as the percent change of the total vessel length in PTN97-110-treated compared with the vehicle (PBS)-treated CAMs (control) from at least four independent experiments. The box plots indicate the median, mean, and range of each group. Asterisks denote a statistically significant difference from the control. ***P < 0.001, ****P < 0.0001. The pictures are representative of the vessel network of the chicken embryo CAM. |
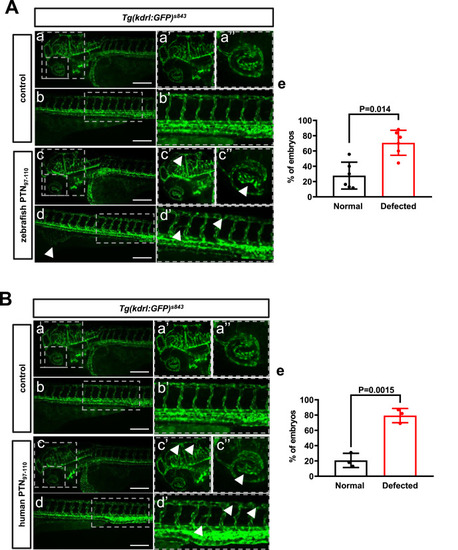
PTN97–110 affects angiogenesis in the zebrafish. (A) (a–d) Images illustrating the blood vessels at 72 hpf Tg(kdrl:GFP)s843 control and embryos injected with the zebrafish peptide, as seen from a left lateral. The dashed boxed regions are displayed at higher magnification in panels (a’-d’). (a’-d’) Higher magnifications of blood vessels in specified boxes. Injected embryos revealed a disorganized blood vessel arrangement in the head (c’), eye (c’’), ISV, and DLAV (d’’). Scale bar 200 μm. (e) Percentage of control and zebrafish PTN97-110 injected embryos with disorganized blood vessels. (B) (a–d) Images illustrating the blood vessels at 72 hpf Tg(kdrl:GFP)s843 control and injected embryos with the human peptide, as seen from a left lateral. The dashed boxed regions are displayed at higher magnification in panels (a’-d’). (a’-d’) Higher magnifications of blood vessels in specified boxes. Injected embryos revealed a disorganized blood vessel arrangement in the head (c’), eye (c’’), ISV, and DLAV (d’’). Scale bar 200 μm. (e) Percentage of control and human PTN97-110 injected embryos with disorganized blood vessels. |
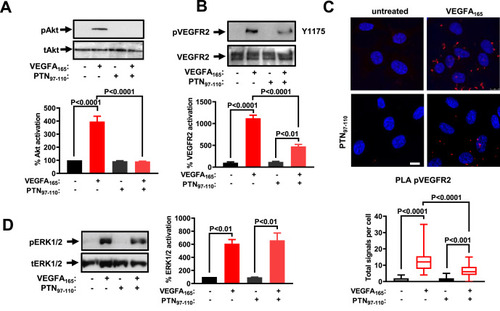
PTN97–110 inhibits VEGFA165-induced signaling in endothelial cells. (A) HUVEC were treated with VEGFA165 (10 ng/ml) and/or PTN97-110 (100 ng/ml) for 10 min and cell lysates were analyzed by antibodies against Akt phosphorylated at Ser473 (pAkt), and total Akt (tAkt). A representative Western blot is shown (n = 3). Results are expressed as the percent pAkt/tAkt ratio compared to untreated HUVEC (set as default = 100). (B) HUVEC were treated with VEGFA165 and/or PTN97-110 for 10 min and cell lysates were analyzed by antibodies against VEGF receptor 2 phosphorylated at Tyr1175 (pVEGFR2), and total VEGF receptor 2 (VEGFR2). A representative Western blot is shown (n = 3). Results are expressed as the percent pVEGFR2/VEGFR2 ratio compared to untreated HUVEC (set as default = 100). (C) Formation of tyrosine phosphorylated VEGF receptor 2 (pVEGFR2) complexes as evidenced by in situ PLA in HUVEC cultured in the presence or absence of VEGFA165 and/or PTN97-110. Representative pictures are shown. The scale bar corresponds to 10 μm. The box plots indicate the detected signals' median, mean, and range (n = 8–10 image fields with 4–8 cells per image per sample type, each sample run in triplicate). (D) HUVEC were treated with VEGFA165 and/or PTN97-110 for 10 min and cell lysates were analyzed by antibodies against ERK1/2 phosphorylated at Tyr895 (pERK1/2), and total ERK1/2 (tERK1/2). Representative Western blots are shown (n = 3). Results are expressed as mean ± SD of the percent pERK1/2/tERK1/2 ratio compared to untreated HUVEC (set as default = 100). |
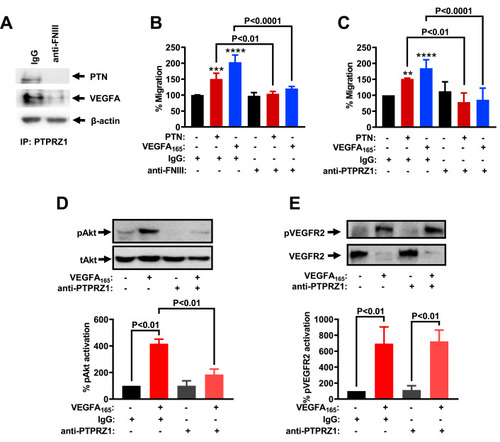
Antibodies against the PTPRZ1 FNIII domain inhibit PTN and VEGFA165-induced endothelial cell migration and signaling. (A) HUVEC were incubated in the presence or absence of anti-FNIII (10 ng/ml) or mouse IgG (10 ng/ml) for 24 h. Total cell lysates were then immunoprecipitated by using an antibody against the C-terminus of PTPRZ1 or non-specific IgG and analyzed by Western blot using an antibody against PTN or VEGFA. The content of β-actin in the corresponding lysate was used as a loading control. Representative images from two independent experiments are shown. (B) Migration of HUVEC in the presence or absence of PTN (100 ng/ml), VEGFA165 (10 ng/ml), and/or anti-FNIII (10 ng/ml). Results are expressed as mean ± SD (n = 4) of the percent number of migrated cells compared to the untreated cells (set as default 100%). (C) Migration of HUVEC in the presence or absence of PTN, VEGFA165, and/or anti-PTPRZ1 (10 ng/ml). Results are expressed as mean ± SD (n = 5 for VEGFA165 and 3 for PTN) of the percent number of migrated cells compared to the untreated cells (set as default 100%). (D) HUVEC were treated with VEGFA165 and/or anti-PTPRZ1 for 10 min and cell lysates were analyzed by antibodies against Akt phosphorylated at Ser473 (pAkt), and total Akt (tAkt). A representative Western blot is shown. Results are expressed as mean ± SD (n = 2) of the percent pAkt/tAkt ratio compared to untreated HUVEC (set as default = 100). (E) HUVEC were treated with VEGFA165 and/or anti-PTPRZ1 for 10 min and cell lysates were analyzed by antibodies against VEGF receptor 2 phosphorylated at Tyr1175 (pVEGFR2), and total VEGF receptor 2 (VEGFR2). A representative Western blot is shown. Results are expressed as mean ± SD (n = 3) of the percent pVEGFR2/VEGFR2 ratio compared to untreated HUVEC (set as default = 100). |
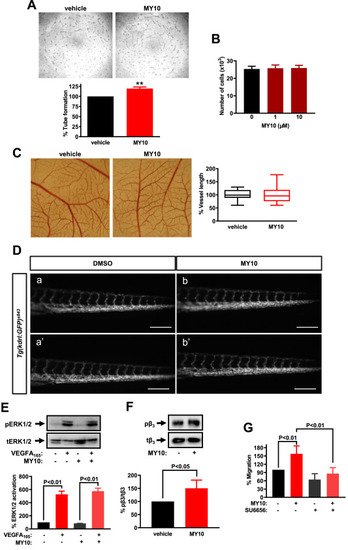
Effects of a selective PTPRZ1 tyrosine phosphatase inhibitor. (A) Representative photos and quantification of the tube network formed by HUVEC on the Matrigel in the presence or absence of MY10 (10 μΜ). Results are expressed as mean ± SD (n = 4) of the percent tube length compared to the untreated cells (set as default 100%). (B) Number of HUVEC in the presence or absence of MY10 for 24 h. Results are expressed as mean ± SD (n = 3). (C) MY10 (20 nmol/egg) or the vehicle (DMSO 10%) was applied to the CAM, and 48 h later, the total vessel length was estimated using image analysis software. Results are expressed as the mean ± SD (n = 22) of the percent change of the total vessel length in the MY10-treated compared with the tissues treated with the vehicle (DMSO 1%) from at least four independent experiments. The pictures are representative of the vessel network of the chick embryo CAM. (D) Microscope inverted images illustrating the tail blood vessels of 72 hpf Tg(kdrl:GFP)s843 zebrafish embryos. Embryos injected at 1-cell stage with (a,a’) DMSO (0.6%) or (b,b’) with MY10 (0.28 pmol/egg). The scale bar corresponds to 200 μm. In both the CAM and the zebrafish assays, the maximum non-toxic DMSO concentration determined the dose of MY10 used. (E) HUVEC were treated with VEGFA165 (10 ng/ml) and/or MY10 for 10 min and cell lysates were analyzed by antibodies against ERK1/2 phosphorylated at Tyr895 (pERK1/2), and total ERK1/2 (tERK1/2). Representative Western blots are shown. Results are expressed as mean ± SD (n = 3) of the percent pERK1/2/tERK1/2 ratio compared to untreated HUVEC (set as default = 100). (E) HUVEC were treated with MY10 for 10 min and cell lysates were analyzed by antibodies against β3 integrin phosphorylated at Tyr773 (pβ3), and total β3 (tβ3). A representative Western blot is shown. Results are expressed as mean ± SD (n = 3) of the percent pβ3/tβ3 ratio compared to untreated HUVEC (set as default = 100). (F) Migration of HUVEC in the presence or absence of MY10, and/or SU6656 (10 μM). Results are expressed as mean ± SD (n = 3) of the percent number of migrated cells compared to the untreated cells (set as default 100%). |
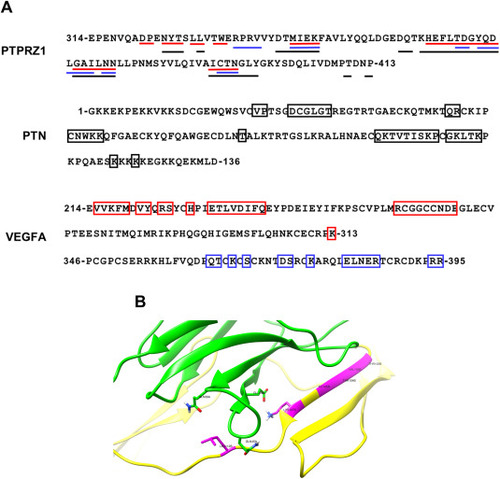
Molecular Docking Calculations. (A) Residue sequences for PTPRZ1, VEGFA residues 219–313 (PDB: 3v2a) and 346-295 (PDB: 4deq) and PTN. The residues that are mainly involved in the binding interactions as predicted for the PTN/PTPRZ1 (black) and VEGFA/PTPRZ1 (red for residues 219–313 and blue for residues 346–395) complexes by the PRODIGY tool are shown in boxes. The numbering for the two VEGFA regions (3v2a and 4deq) corresponds to the canonical sequence of VEGFA (Uniprot ID: P15692). The numbering of PTN corresponds to the mature protein following the removal of the signaling peptide (Uniprot ID: P21246). The numbering of PTPRZ1 FNIII corresponds to the canonical sequence of PTPRZ1 (Uniprot ID: 23471/PDB ID:8fn8). (B) Interaction between PTN (yellow) and PTPRZ1 (green) as predicted by HADDOCK molecular docking. The magenta-colored residues represent the PTN residues that are primarily involved in the interaction between the two proteins. |

Schematic representation of the pathway proposed by the present study, by incorporating knowledge from our previous studies, as shown. In brief, VEGFA165 or PTN binds to the FNIII domain of PTPRZ1 and inhibits its tyrosine phosphatase activity, leading to c-Src activation, phosphorylation of β3 integrin at Tyr773, activation of c-Met and Akt, and activation of endothelial cell migration. VEGFA165 activates endothelial cells by also binding to VEGF receptor 2. The exact role of the interaction of β3 integrin with VEGFR2 needs to be further studied. Inhibition of VEGFA165 binding to PTPRZ1 by our identified PTN97-110 peptide or an anti-PTPRZ1 antibody against the PTPRZ1 FNIII domain inhibits the stimulatory effects of VEGFA165 and PTN on cell migration and warrants further exploitation for the development of novel therapeutics. |
Reprinted from European Journal of Pharmacology, 977, Choleva, E., Menounou, L., Ntenekou, D., Kastana, P., Tzoupis, Η., Katraki-Pavlou, S., Drakopoulou, M., Spyropoulos, D., Andrikopoulou, A., Kanellopoulou, V., Enake, M.K., Beis, D., Papadimitriou, E., Targeting the interaction of pleiotrophin and VEGFA165 with protein tyrosine phosphatase receptor zeta 1 inhibits endothelial cell activation and angiogenesis, 176692, Copyright (2024) with permission from Elsevier. Full text @ Eur. J. Pharmacol.