
Fig. 7
- ID
- ZDB-FIG-240703-72
- Publication
- Choleva et al., 2024 - Targeting the interaction of pleiotrophin and VEGFA165 with protein tyrosine phosphatase receptor zeta 1 inhibits endothelial cell activation and angiogenesis
- Other Figures
- All Figure Page
- Back to All Figure Page
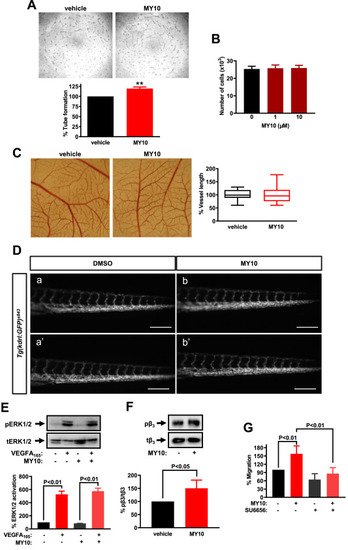
Effects of a selective PTPRZ1 tyrosine phosphatase inhibitor. (A) Representative photos and quantification of the tube network formed by HUVEC on the Matrigel in the presence or absence of MY10 (10 μΜ). Results are expressed as mean ± SD (n = 4) of the percent tube length compared to the untreated cells (set as default 100%). (B) Number of HUVEC in the presence or absence of MY10 for 24 h. Results are expressed as mean ± SD (n = 3). (C) MY10 (20 nmol/egg) or the vehicle (DMSO 10%) was applied to the CAM, and 48 h later, the total vessel length was estimated using image analysis software. Results are expressed as the mean ± SD (n = 22) of the percent change of the total vessel length in the MY10-treated compared with the tissues treated with the vehicle (DMSO 1%) from at least four independent experiments. The pictures are representative of the vessel network of the chick embryo CAM. (D) Microscope inverted images illustrating the tail blood vessels of 72 hpf Tg(kdrl:GFP)s843 zebrafish embryos. Embryos injected at 1-cell stage with (a,a’) DMSO (0.6%) or (b,b’) with MY10 (0.28 pmol/egg). The scale bar corresponds to 200 μm. In both the CAM and the zebrafish assays, the maximum non-toxic DMSO concentration determined the dose of MY10 used. (E) HUVEC were treated with VEGFA165 (10 ng/ml) and/or MY10 for 10 min and cell lysates were analyzed by antibodies against ERK1/2 phosphorylated at Tyr895 (pERK1/2), and total ERK1/2 (tERK1/2). Representative Western blots are shown. Results are expressed as mean ± SD (n = 3) of the percent pERK1/2/tERK1/2 ratio compared to untreated HUVEC (set as default = 100). (E) HUVEC were treated with MY10 for 10 min and cell lysates were analyzed by antibodies against β3 integrin phosphorylated at Tyr773 (pβ3), and total β3 (tβ3). A representative Western blot is shown. Results are expressed as mean ± SD (n = 3) of the percent pβ3/tβ3 ratio compared to untreated HUVEC (set as default = 100). (F) Migration of HUVEC in the presence or absence of MY10, and/or SU6656 (10 μM). Results are expressed as mean ± SD (n = 3) of the percent number of migrated cells compared to the untreated cells (set as default 100%). |
Reprinted from European Journal of Pharmacology, 977, Choleva, E., Menounou, L., Ntenekou, D., Kastana, P., Tzoupis, Η., Katraki-Pavlou, S., Drakopoulou, M., Spyropoulos, D., Andrikopoulou, A., Kanellopoulou, V., Enake, M.K., Beis, D., Papadimitriou, E., Targeting the interaction of pleiotrophin and VEGFA165 with protein tyrosine phosphatase receptor zeta 1 inhibits endothelial cell activation and angiogenesis, 176692, Copyright (2024) with permission from Elsevier. Full text @ Eur. J. Pharmacol.