
- Title
-
Radix Rehmanniae Praeparata promoted zebrafish fin regeneration through aryl hydrocarbon receptor-dependent autophagy
- Authors
- Chen, F., Pu, S., Tian, L., Zhang, H., Zhou, H., Yan, Y., Hu, X., Wu, Q., Chen, X., Cheng, S.H., Xu, S.
- Source
- Full text @ J. Ethnopharmacol.
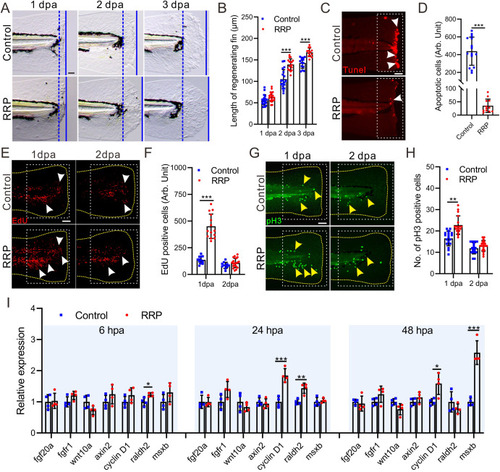
RRP extract promoted zebrafish larvae fin regeneration. A. Representative images showing the regenerating fin of zebrafish larvae exposed to RRP and E3 medium control. Blue dashed lines indicate the initial cutting site of the fin, and the blue lines indicate the end of the regenerating fin at 1 dpa, 2 dpa, and 3 dpa. The distance between the blue dashed line and the blue line represents the length of the fin regenerated. Scale bar: 100 μm. B. Bar chart showing the quantitative results in panel A, n = 14∼20. C. Representative images showing apoptotic cells (white arrow) in the wound of 6 hpa zebrafish larvae with different regimens. D. Bar chart showing the quantitative results in panel C, n = 12∼15. E-H. Representative images showing proliferating cells at S-phase (E, white arrow) and mitotic cells at M-phase (G, yellow arrow) in the wound of zebrafish larvae with different regimens, respectively. The yellow dashed line area displays the shape of the tail in E and G. The white dotted boxes represent the statistical areas. Scale bar: 200 μm. F, H. Bar chart showing the quantitative results in panel E (n = 11∼19) and G(n = 17∼20), respectively. I. qRT-PCR determined the relative expression of regeneration-related genes. n = 4. Asterisks in panel B, D, F, H, and I represent the significant difference observed when compared with the control at p < 0.05 (*), p < 0.01 (**) or p < 0.001 (***) level with unpaired two tail t-test. |
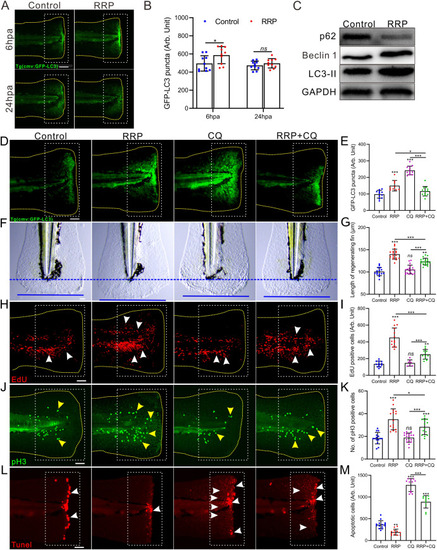
RRP stimulated autophagy during zebrafish caudal fin regeneration. A. Representative images showing the autophagy puncta (green fluorescence) at the injured site in fin of Tg (cmv: GFP-LC3) zebrafish. Scale bar: 200 μm. B. The bar chart showing the statistical result in panel A, n = 10. C. Western blotting images to show the relative expression levels of autophagy related proteins in different regimens at 6 hpa. D. Representative images showing the autophagy puncta (green fluorescence) at the injured site in fin of Tg (cmv: GFP-LC3) zebrafish in different regimens. Scale bar: 200 μm. E. The bar chart showing the statistical result in panel D, n = 9∼12. F. Representative images showing the length of regenerating fin at 2 dpa in different regimens. Blue dashed lines indicate the initial cutting site of the fin, and the blue lines indicate the end of the regenerating fin at 2 dpa. The distance between the blue dashed line and the blue line represents the length of the fin regenerated. Scale bar: 100 μm. G. Bar chart showing the quantitative results in panel F, n = 15∼20. H-M. Representative images showing proliferating cells at S-phage (H, red dot, white arrow), mitotic cells at M-phage (J, green dot, yellow arrow), and apoptotic cells (L, red dot, white arrow) in the wound of 1 dpa, 2 dpa, and 6 hpa zebrafish larvae with different regimens, respectively. Scale bar: 200 μm. Bar chart of I, K, and M showing the quantitative results in panel H (n = 7∼14), J (n = 14∼16), and L (n = 11∼15), respectively. The yellow dashed line in each panel displays the shape of the tail in A, D, H and J. The white dotted boxes represent the statistical areas. Data were expressed as mean ± S.D., and statistical results were analyzed by Unpaired two tail t-test (B) and one-way ANOVA with Tukey's post hoc test (E, G, I, K, M). Asterisk in panel B, E, G, I, K, and M represent the significant difference observed when compared with the other group at p < 0.05 (*), p < 0.01 (**) or p < 0.001 (***) level. |
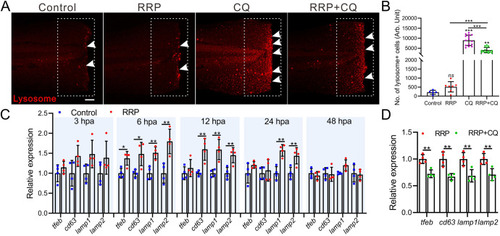
RRP promoted lysosomes biogenesis during regeneration. A. Representative images of lysosome (white arrow) in regenerating fins of zebrafish with different regimens. Scale bar: 200 μm. B. The bar chart showing the statistical results of lysosomes in panel A, n = 5∼15. C, D. qRT-PCR determined the relative expression of lysosome-related genes with different regimens. Data were expressed as mean ± S.D. and analyzed by one-way ANOVA with Tukey's post hoc test (B) or unpaired two tail t-test (C, D), n = 4. Asterisk represent the significant difference observed when compared with the other group at p < 0.05 (*), p < 0.01 (**) or p < 0.001 (***) level. |
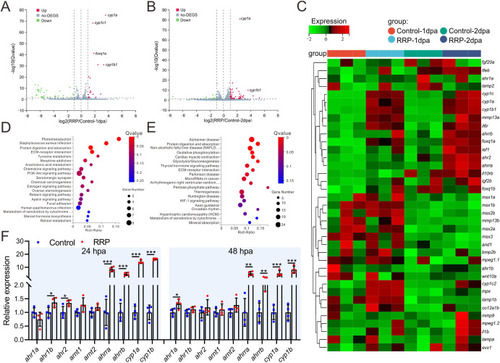
Comparative transcriptome analysis of fin regeneration in zebrafish following RRP treatment. A, B. The volcano map showing the profile of differential expressed gene (fold change >1.5, p < 0.05) in regenerating fin of the fish exposure to RRP and E3 control at 1 dpa (A) and 2 dpa (B), n = 3. C. Heat map showing the representative differential expressed genes in the regenerating fin between RRP and control group at 1dpa and 2dpa, n = 3. D, E. KEGG analysis of differential expressed gene enrichment signal pathways at 1 dpa (D) and 2 dpa (E), n = 3. F. qRT-PCR analysis the expression of ahr-related genes at 1 and 2 dpa with RRP or control group. The statistical analysis was performed using an unpaired two-tailed t-test, n = 4. p < 0.05 was considered as significant difference. “***” p < 0.001, “**” p < 0.01, “*” p < 0.05. |
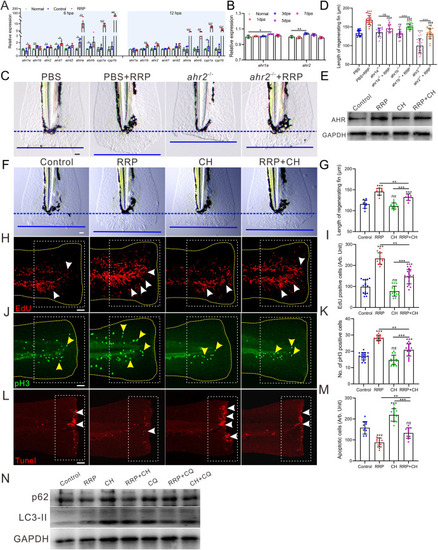
RRP promoted fin regeneration by regulating AHR signaling pathway. A. qRT-PCR analysis the expression of ahr-related genes at 6 and 12 hpa in the regenerating fin of normal, fin amputated control and fin amputated with RRP treatment group, n = 4. B. Bar chart showing the statistical data of ahr1a and ahr2 expression in zebrafish regenerating heart, n = 4. C. Representative images showing the length of regenerating fin in ahr2 crispant fish at 2 dpa in different regimens. Blue dashed lines indicate the initial cutting site of the fin, and the blue lines indicate the end of the regenerating fin at 2 dpa. The distance between the blue dashed line and the blue line represents the length of the fin regenerated. Scale bar: 100 μm. D. Bar chart showing the statistical data of the length in ahr2 (pane C), ahr1a and ahr1b (Supp. Fig. S3 A) crispant fish, n = 18∼24. E. Western blotting analysis the expression of AHR in the regenerating fin of the fish with different regimens. F. Representative images showing the length of regenerating fin in fish with different treatment. G. Bar chart showing the quantitative results in panel F, n = 8∼12. H-M. Representative images showing proliferating cells at S-phage (H, red dot, white arrow), mitotic cells at M-phage (J, green dot, yellow arrow), and apoptotic cells (L, red dot, white arrow) in the wound of 1 dpa, 2 dpa, and 6 hpa zebrafish larvae with different regimens, respectively. Scale bar: 200 μm. Bar chart of I, K, and M showing the quantitative results in panel H (n = 14∼17), J (n = 13∼16), and L (n = 10∼13), respectively. The yellow dashed line in each panel displays the shape of the tail in H and J. The white dotted boxes represent the statistical areas. N. Western blotting analysis the expression of LC3-II and p62 in the regenerating fin of the fish with different regimens. CH, CH-223191. Data were expressed as mean ± standard deviation, and statistical results were analyzed using unpaired two-tail t-test (A) and one-way ANOVA with Tukey's post hoc test (B, D, G, I, K, M). p < 0.05 was considered as significant difference. “***” p < 0.001, “**” p < 0.01, “*” p < 0.05, “ns” indicated no significant difference was observed. |
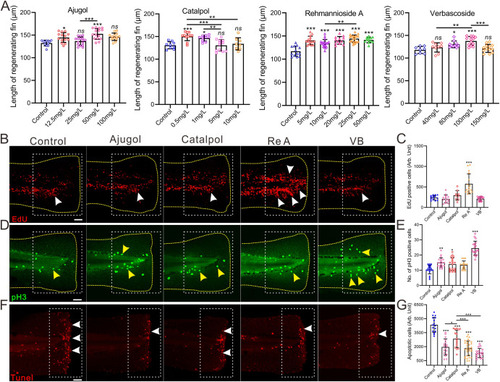
RRP ingredients boosted zebrafish fin regeneration. A. Bar charts showing the length of the regenerating fin of zebrafish exposure to different concentrations of RRP ingredients at 2 dpa, n = 8∼20. B-G, Representative images showing proliferating cells at S-phage (B, red dot, white arrow), mitotic cells at M-phage (D, green dot, yellow arrow), and apoptotic cells (F, red dot, white arrow) in the fin zebrafish at 1 dpa, 2 dpa, and 6 hpa with different regimens, respectively. Scale bar: 200 μm. Bar chart of C, E, and G showing the quantitative results in panel B (n = 9∼15), D (n = 17∼20), and F (n = 15∼32), respectively. The yellow dashed line in each panel displays the shape of the tail in B, and D. The white dotted boxes represent the statistical areas. Data were expressed as mean ± S.D. and statistical results were analyzed by one-way ANOVA with Tukey's post hoc test (A, C, E, G). The asterisk represents the significant difference observed when compared with the other group at p < 0.05 (*), p < 0.01 (**) or p < 0.001 (***) level, “ns” indicated no significant difference was observed. |