
|
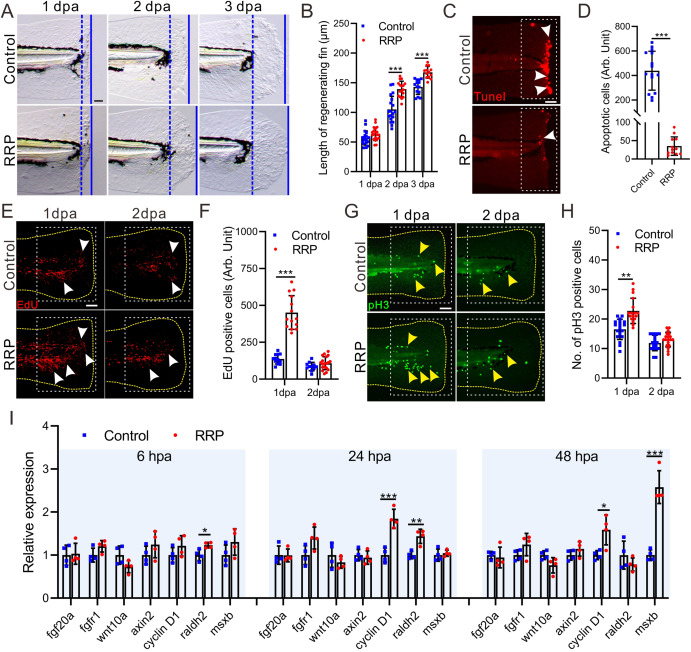
Fig. 1 RRP extract promoted zebrafish larvae fin regeneration. A. Representative images showing the regenerating fin of zebrafish larvae exposed to RRP and E3 medium control. Blue dashed lines indicate the initial cutting site of the fin, and the blue lines indicate the end of the regenerating fin at 1 dpa, 2 dpa, and 3 dpa. The distance between the blue dashed line and the blue line represents the length of the fin regenerated. Scale bar: 100 μm. B. Bar chart showing the quantitative results in panel A, n = 14∼20. C. Representative images showing apoptotic cells (white arrow) in the wound of 6 hpa zebrafish larvae with different regimens. D. Bar chart showing the quantitative results in panel C, n = 12∼15. E-H. Representative images showing proliferating cells at S-phase (E, white arrow) and mitotic cells at M-phase (G, yellow arrow) in the wound of zebrafish larvae with different regimens, respectively. The yellow dashed line area displays the shape of the tail in E and G. The white dotted boxes represent the statistical areas. Scale bar: 200 μm. F, H. Bar chart showing the quantitative results in panel E (n = 11∼19) and G(n = 17∼20), respectively. I. qRT-PCR determined the relative expression of regeneration-related genes. n = 4. Asterisks in panel B, D, F, H, and I represent the significant difference observed when compared with the control at p < 0.05 (*), p < 0.01 (**) or p < 0.001 (***) level with unpaired two tail t-test.