
|
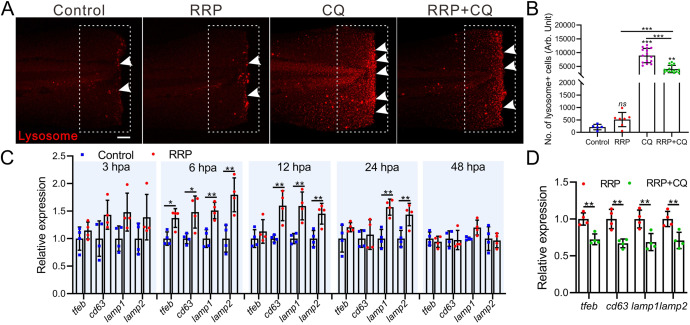
Fig. 3 RRP promoted lysosomes biogenesis during regeneration. A. Representative images of lysosome (white arrow) in regenerating fins of zebrafish with different regimens. Scale bar: 200 μm. B. The bar chart showing the statistical results of lysosomes in panel A, n = 5∼15. C, D. qRT-PCR determined the relative expression of lysosome-related genes with different regimens. Data were expressed as mean ± S.D. and analyzed by one-way ANOVA with Tukey's post hoc test (B) or unpaired two tail t-test (C, D), n = 4. Asterisk represent the significant difference observed when compared with the other group at p < 0.05 (*), p < 0.01 (**) or p < 0.001 (***) level.