
|
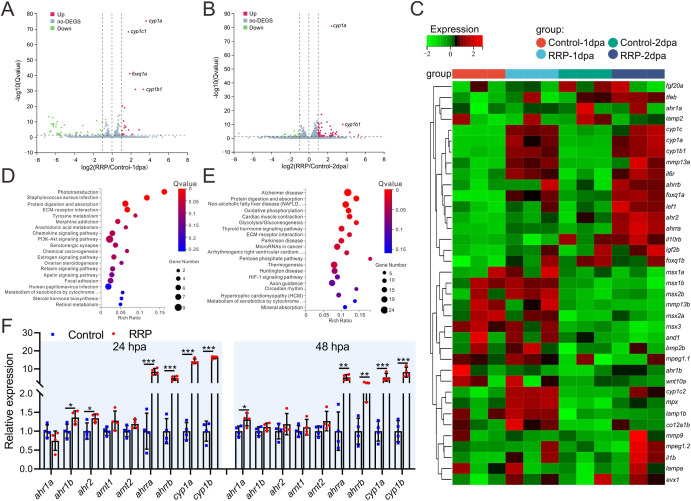
Fig. 4 Comparative transcriptome analysis of fin regeneration in zebrafish following RRP treatment. A, B. The volcano map showing the profile of differential expressed gene (fold change >1.5, p < 0.05) in regenerating fin of the fish exposure to RRP and E3 control at 1 dpa (A) and 2 dpa (B), n = 3. C. Heat map showing the representative differential expressed genes in the regenerating fin between RRP and control group at 1dpa and 2dpa, n = 3. D, E. KEGG analysis of differential expressed gene enrichment signal pathways at 1 dpa (D) and 2 dpa (E), n = 3. F. qRT-PCR analysis the expression of ahr-related genes at 1 and 2 dpa with RRP or control group. The statistical analysis was performed using an unpaired two-tailed t-test, n = 4. p < 0.05 was considered as significant difference. “***” p < 0.001, “**” p < 0.01, “*” p < 0.05.