
|
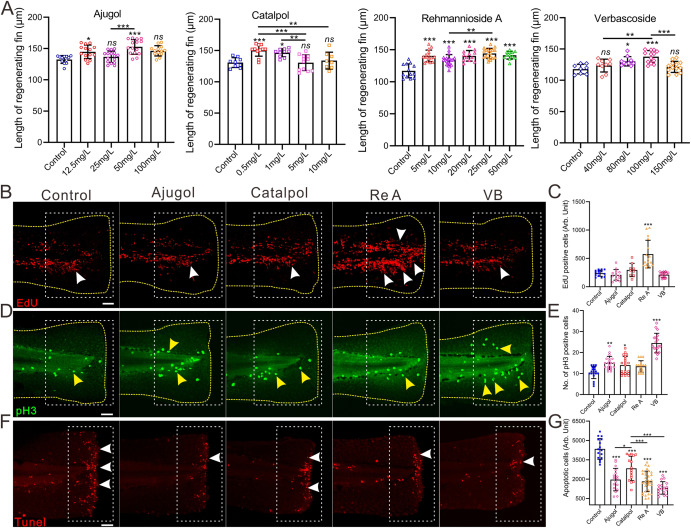
Fig. 6 RRP ingredients boosted zebrafish fin regeneration. A. Bar charts showing the length of the regenerating fin of zebrafish exposure to different concentrations of RRP ingredients at 2 dpa, n = 8∼20. B-G, Representative images showing proliferating cells at S-phage (B, red dot, white arrow), mitotic cells at M-phage (D, green dot, yellow arrow), and apoptotic cells (F, red dot, white arrow) in the fin zebrafish at 1 dpa, 2 dpa, and 6 hpa with different regimens, respectively. Scale bar: 200 μm. Bar chart of C, E, and G showing the quantitative results in panel B (n = 9∼15), D (n = 17∼20), and F (n = 15∼32), respectively. The yellow dashed line in each panel displays the shape of the tail in B, and D. The white dotted boxes represent the statistical areas. Data were expressed as mean ± S.D. and statistical results were analyzed by one-way ANOVA with Tukey's post hoc test (A, C, E, G). The asterisk represents the significant difference observed when compared with the other group at p < 0.05 (*), p < 0.01 (**) or p < 0.001 (***) level, “ns” indicated no significant difference was observed.