
|
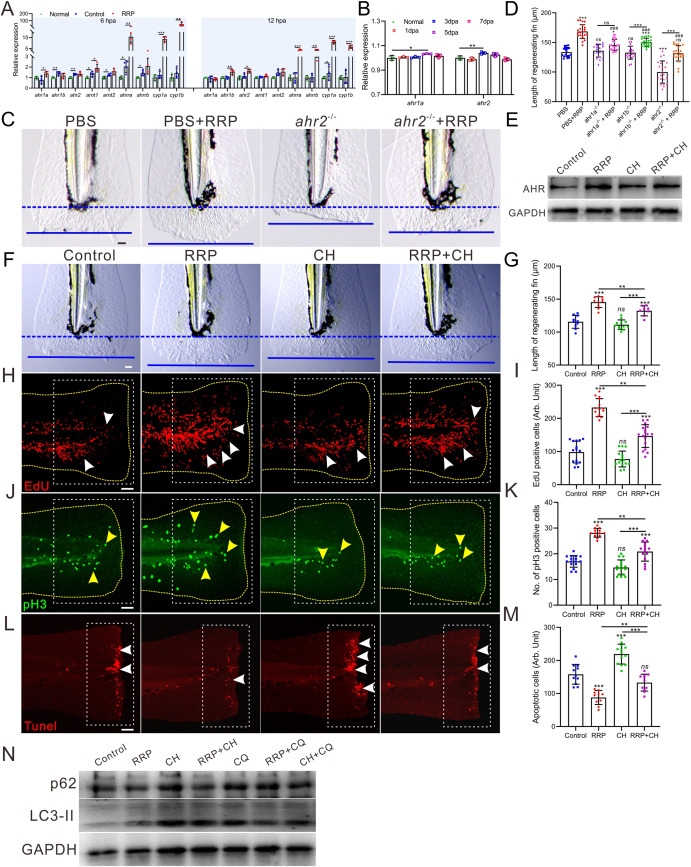
Fig. 5 RRP promoted fin regeneration by regulating AHR signaling pathway. A. qRT-PCR analysis the expression of ahr-related genes at 6 and 12 hpa in the regenerating fin of normal, fin amputated control and fin amputated with RRP treatment group, n = 4. B. Bar chart showing the statistical data of ahr1a and ahr2 expression in zebrafish regenerating heart, n = 4. C. Representative images showing the length of regenerating fin in ahr2 crispant fish at 2 dpa in different regimens. Blue dashed lines indicate the initial cutting site of the fin, and the blue lines indicate the end of the regenerating fin at 2 dpa. The distance between the blue dashed line and the blue line represents the length of the fin regenerated. Scale bar: 100 μm. D. Bar chart showing the statistical data of the length in ahr2 (pane C), ahr1a and ahr1b (Supp. Fig. S3 A) crispant fish, n = 18∼24. E. Western blotting analysis the expression of AHR in the regenerating fin of the fish with different regimens. F. Representative images showing the length of regenerating fin in fish with different treatment. G. Bar chart showing the quantitative results in panel F, n = 8∼12. H-M. Representative images showing proliferating cells at S-phage (H, red dot, white arrow), mitotic cells at M-phage (J, green dot, yellow arrow), and apoptotic cells (L, red dot, white arrow) in the wound of 1 dpa, 2 dpa, and 6 hpa zebrafish larvae with different regimens, respectively. Scale bar: 200 μm. Bar chart of I, K, and M showing the quantitative results in panel H (n = 14∼17), J (n = 13∼16), and L (n = 10∼13), respectively. The yellow dashed line in each panel displays the shape of the tail in H and J. The white dotted boxes represent the statistical areas. N. Western blotting analysis the expression of LC3-II and p62 in the regenerating fin of the fish with different regimens. CH, CH-223191. Data were expressed as mean ± standard deviation, and statistical results were analyzed using unpaired two-tail t-test (A) and one-way ANOVA with Tukey's post hoc test (B, D, G, I, K, M). p < 0.05 was considered as significant difference. “***” p < 0.001, “**” p < 0.01, “*” p < 0.05, “ns” indicated no significant difference was observed.