
- Title
-
Bax inhibitor 1 is a γ-secretase-independent presenilin-binding protein
- Authors
- Wu, S., Song, W., Wong, C.C.L., Shi, Y.
- Source
- Full text @ Proc. Natl. Acad. Sci. USA
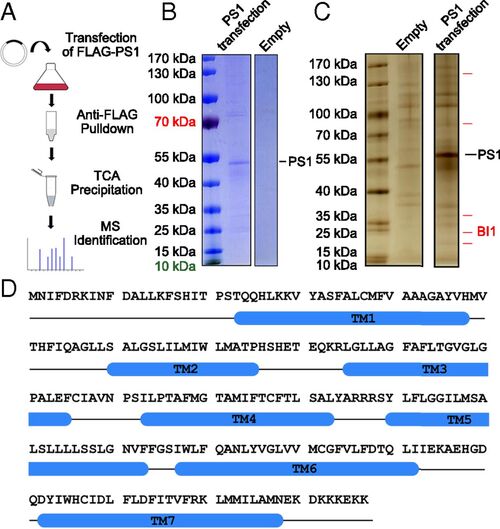
Identification of BI1 as a potential PS1-binding protein. (A) Procedure for the identification of potential PS1-binding proteins. The FLAG-tagged human PS1 was overexpressed in HEK293F cells and purified by the M2 affinity resin. The eluted proteins were precipitated by trichloroacetic acid (TCA) and analyzed by MS. (B) Affinity-purified proteins were examined on an SDS/PAGE gel and stained by Coomassie blue. The full-length human PS1 is clearly present in the sample derived from PS1 transfection, but not in the sample derived from the empty vector control. (C) Affinity-purified proteins were examined by silver staining. A number of proteins are uniquely present in the sample derived from PS1 transfection. (D) Amino acid sequence of BI1. Blue cylinders denote predicted transmembrane helices (TMs) based on the structure of the bacterial BI1 homolog BsYetJ (60). |
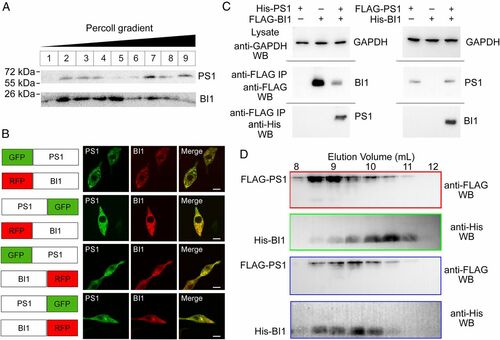
BI1 and PS1 form a stable complex. (A) Subcellular fractionation shows colocalization of FLAG-tagged PS1 and His6-tagged BI1. The PNS of HEK293F cells was fractionated on 30% Percoll and subjected to Western blot analysis using a monoclonal antibody against the His6 or FLAG tag. (B) PS1 and BI1 colocalize in HEK293 cells. PS1 and BI1 were fused with GFP and RFP, respectively, at their N or C termini. In all four combinations, PS1 and BI1 colocalize in cells by confocal microscopy. (Scale bar, 10 μm.) (C) PS1 interacts with BI1 in the IP-Western analysis. The cellular extract was immunoprecipitated using an anti-FLAG monoclonal antibody, and the pellet was examined by Western blot (WB) using anti-FLAG and anti-His6 antibodies. IP, immunoprecipitation. (D) PS1 and BI1 form a stable complex. The recombinant FLAG-tagged PS1 and His6-tagged BI1 were individually or together applied to gel filtration. The fractions were examined by Western blot. |
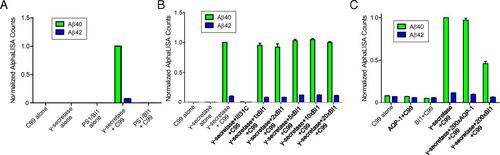
PS1–BI1 complex exhibits no proteolytic activity toward the APP-C99 substrate. (A) PS1–BI1 complex failed to generate Aβ42 or Aβ40 using the APP-C99 substrate. The spectroscopic reading of Aβ40 by γ-secretase is normalized as 1.0. The PS1–BI1 complex has no detectable activity. (B) Recombinant BI1 protein exhibits no apparent impact on the production of Aβ42 or Aβ40 by γ-secretase in vitro. Compared with γ-secretase, the amount of BI1 varied from equimolar to a 20-fold molar excess. (C) BI1 at a 200-fold molar excess inhibited the production of Aβ42 or Aβ40 by γ-secretase. The effect is specific because the control protein, AQP-1, at a 200-fold molar excess exhibited no impact on the proteolytic activity of γ-secretase. |
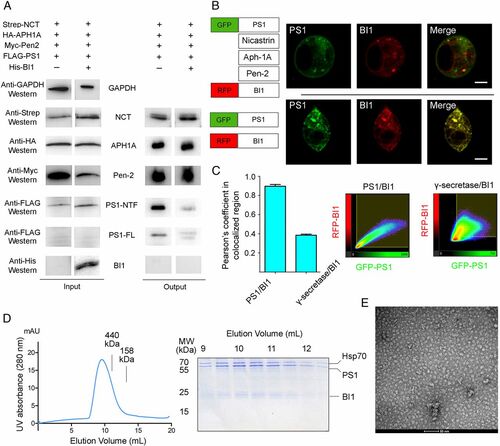
BI1 binds the isolated PS1, but not PS1 in the context of an assembled γ-secretase. (A) BI1 is absent in the purified γ-secretase. (Left) All four components of γ-secretase and BI1 are readily detectable upon cellular overexpression. (Right) Following affinity purification of the FLAG-tagged PS1, the other three components of γ-secretase, but not BI1, are detectable by Western blot. (B) Colocalization of PS1 and BI1 is altered by expression of the other three components of. γ-secretase. (Top) Coexpression of GFP-PS1 and RFP-BI1 reveals excellent colocalization. (Bottom) Extent of colocalization is markedly reduced by coexpression of the other three components of γ-secretase (Scale bar, 10 μm.) (C) Quantification of colocalization between PS1 and BI1 by Pearson’s coefficient in colocalized volume. (Left) Coefficient in the presence of PS1 overexpression alone is considerably higher than that in the presence of overexpression by all four components of γ-secretase. (Right) Typical 2D correlation diagrams. (D) Purification of the PS1–BI1 complex for structural studies. (Left) Representative gel filtration chromatograph of the two-step purified human PS1–BI1 complex. (Right) Aliquots of the peak fractions are visualized in an SDS/PAGE gel. (E) Analysis of the purified PS1–BI1 complex by negative-staining EM. Shown here is a representative micrograph of the PS1–BI1 complex. |
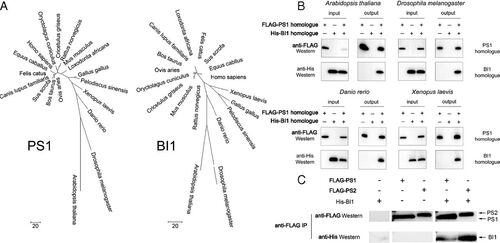
PS1–BI1 interaction is evolutionarily conserved. (A) Phylogenetic trees of PS1 and BI1. The evolutionary history was inferred using the maximum parsimony method. PS1 and BI1 exhibit a similar pattern of evolutionary history in eukaryotic species, suggesting coevolution of the two proteins. Evolutionary analyses were conducted in MEGA7 (61). (B) PS1 and BI1 homologs interact with each other in four representative model organisms. Shown here are results of the IP-Western assays. (C) BI1 also binds to PS2, which exhibits strong sequence homology to PS1. Shown here are results of the pulldown experiments. |