FIGURE SUMMARY
Title

Macrophage depletion overcomes human hematopoietic cell engraftment failure in zebrafish embryo

Authors
El Omar, R., Abdellaoui, N., Coulibaly, S.T., Fontenille, L., Lanza, F., Gachet, C., Freund, J.N., Negroni, M., Kissa, K., Tavian, M.
Source
Full text @ Cell Death Dis.

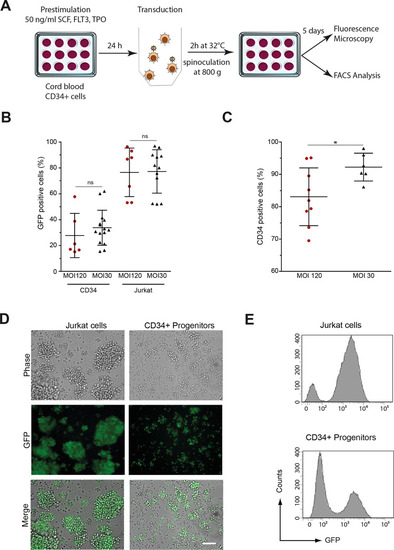
Transgene transfer and GFP expression after transduction of human CD34+ and Jurkat cells.

A Human CD34+ blood cells from umbilical cord blood and Jurkat cells were transduced by spin inoculation with lentiviral vectors encoding a nuclear variant of the eGFP at multiplicity of infection (MOI) of 30 and 120 and cultured in vitro. After 5 days, cells were analyzed for GFP expression by both flow cytometry and fluorescence microscopy. B Estimates of the efficiency of transduction based on the percentage of GFP+ cells. C Percentage of cells expressing CD34 after 5 days of culture. D, E A representative experiment showing GFP expression after transduction of human CD34+ or Jurkat cells at the MOI of 30. In (E), results are represented as histograms of GFP fluorescence intensity (x-axis, log scale) versus cell number (y-axis, linear).

Transplantation of human JK-GFP cells in zebrafish embryos, colonization of hematopoietic organs and proliferation.

A Transplantation of JK-GFP cells in the caudal vein of a wildtype zebrafish embryo at 36 h.p.f. BD Colonization of zebrafish hematopoietic tissues followed from 1 to 7 d.p.T. Colonization of the CHT (B, E, arrows), thymus (F, arrows), fetal liver (G, arrows), kidney (H, arrows). See Video 1. I Live imaging of JK-GFP cells circulation (asterisk) and proliferation (arrow) in the CHT (Time code 00:15 and 00:24). See Video 2. CHT: Caudal Hematopoietic Tissue. Scale bars: (AD): 250 µm; (EH):100 µm, (I): 25 µm. Time code in minutes.

Human JK-GFP cells phagocytosis by zebrafish embryonic macrophages.

A Live imaging of JK-GFP cells injected in a zebrafish embryo at 30 h.p.f. (arrows indicate two cells). Starting from 33 min post transplantation, some green cells appear fragmented (C, D arrows). D Inset shows a high magnification of fragmented cells at 61 min (arrows). Each frame is a maximum projection of 3 planes apart 1 μm. See also Video 4. EJ Macrophages recruitment in a 4-d.p.f. Tg (mpeg1:mCherry) zebrafish embryo after injection with PBS (EG) or with JK-GFP cells (HJ) (arrow). Merged picture (J) shows the accumulation of macrophages around JK-GFP cells. K Live imaging of mCherry-macrophages in a 4-d.p.f. embryo, 2 days after transplantation of JK-GFP cells. High magnification reveals the phagocytosis of green human cells engulfed by red host macrophages. Each frame is a maximum projection of 5 planes apart 0.8 μm.See also Video 5. Scale bars: (AD): 25 µm, (EJ): 250 µm, (K): 20 µm. Time code in minutes.

CD34-GFP cells phagocytosis by zebrafish embryonic macrophages.

A, B Z-stack confocal imaging of mCherry-expressing macrophage behavior in a zebrafish embryo 2 h post transplantation (h.p.T.) of CD34-GFP, reveals the accumulation of macrophages around green cells and their phagocytosis (inset C, D and E). A Bright field imaging of caudal hematopoietic tissue in the tail region at 30 h.p.f., merged with confocal fluorescent imaging of CD34-GFP cells and mCherry-expressing macrophages (B). CE” 3 successive z-stacks confocal planes apart 0.8 μm of phagocytosis of CD34-GFP cells by mCherry-expressing macrophage (arrows). See also Video 6. A aorta, CV caudal vein, NC notochord. Scale bars: A, B: 25 µm; CE”:10 µm.

Comparison of injection sites in the zebrafish embryo.

A Different injection sites of zebrafish larvae used in this study. Injection of JK-GFP cells in swim bladder (B, C), hindbrain ventricle (D, E) and yolk sac (F, G), of 30 h.p.f. Tg(mpeg1:mCherry) zebrafish embryos. Merged pictures in the insets show macrophages accumulation at 6 h.p.T. in the swim bladder (C) and the hindbrain ventricle (E) but not in the yolk sac (G). Arrows indicate the site of injection. AGM aorta-gonad-mesonephros, CHT caudal hematopoietic tissue. Scale bar: 250 µm.

Genetic and chemical depletion of macrophages in zebrafish embryos.

Primitive macrophages were genetically and chemically depleted before cell engraftment in Tg (mpeg1:mCherry) zebrafish embryos. AD Complete and efficient depletion of macrophages is observed in PU.1 morphant (B) and in Lipo-C-treated (D) embryos at 35 h.p.f and 48 h.p.f, respectively, compared to controls (A and C) which contain fluorescent macrophages (head arrows). E JK-GFP cells injected in PU.1 treated and non-treated zebrafish embryos are followed for 6 days. Injection into the Duct of Cuvier (DC) of MO-buffer-treated embryos. Injection into the Duct of Cuvier (DC) of PU.1 Morphant embryos. F, G Transplantations of JK-GFP (F) and CD34-GFP (G) cells in the Duct of Cuvier (DC) of Lipo-C-treated embryos show a percentage of engraftment comparable to that obtained with injections into the yolk sac. Scale bar: 250 µm. Injection in the yolk sac of PBS-treated embryos. Injection into the Duct of Cuvier (DC) of PBS-treated embryos. Injection into the Duct of Cuvier (DC) of Lipo-C-treated embryos. Data were presented as mean ± SD and are representative of 3 independent experiments with n = 15–20 (E), n = 10–30 (F) and n = 10–30 (G) embryos/group. (ns not significant or p ≥ 0.05; *p < 0.05; **p < 0.01; ***p < 0.001; ****p < 0.0001).

Acknowledgments
This image is the copyrighted work of the attributed author or publisher, and ZFIN has permission only to display this image to its users. Additional permissions should be obtained from the applicable author or publisher of the image. Full text @ Cell Death Dis.