
- Title
-
Threonine dehydrogenase regulates neutrophil homeostasis but not H3K4me3 levels in zebrafish
- Authors
- Li, N.Z., Wang, Z.X., Zhang, F., Feng, C.Z., Chen, Y., Liu, D.J., Chen, S.B., Jin, Y., Zhang, Y.L., Xie, Y.Y., Huang, Q.H., Wang, L., Li, B., Sun, X.J.
- Source
- Full text @ FEBS J.

The mRNA expression level of tdh is relatively high in neutrophils of zebrafish compared to several acetyl-CoA metabolism related genes. (A) Schematic diagram of some pathways contributing to mitochondrial acetyl-CoA pool in zebrafish. (B) Heatmap showing the mRNA expression levels of enzymes or transporters involved in different metabolic pathways in each distinct cell type. Note that the mRNA expression levels are normalized across samples of each row so that they do not reflect absolute expression levels of these genes. Rela. Exprs, relative expression. scRNA-seq data was download from Zebrafish Blood Viewer Website (https://molpath.shinyapps.io/zebrafishblood/). (C) tSNE plot showing 5 distinct clusters and cells were colored by their cell type annotation in right. (D) tSNE visualization of the mRNA expression levels of some marker genes for cell-type identification. zfpm1and tal1 (HSPCs), lyz and mpx (neutrophils), il17r and themis (T cells), cd37 and igic1s1 (B cells), and zbtb32 and nkl.2 (NK cells) were selected to distinguish each subgroup. (E) tSNE visualization of the expression patterns of tdh (left) and tdh2 (right) in each distinct subgroup. (F) Dot plot showing the expression of key enzymes or transporters involved in glycolysis or mitochondrial acetyl-CoA generation in each distinct cell type. The scRNA-seq data shown in (C) to (F) are from the GEO dataset GSE100911. (G) Heatmap showing the mRNA expression levels of tdh and several related genes in broad types of tissues of WT zebrafish embryo at 24 h post fertilization (hpf). Note that tdh and gcat are ubiquitously expressed but shows relative enrichment in certain tissues, whereas tdh2 and sdsl have almost no expression at this developmental stage. lyz, mpx and cebpb are known markers for neutrophils/myelocytes. The scRNA-seq data exhibited in (G) are from the ZESTA database zf24_scRNA.h5ad dataset (https://db.cngb.org/stomics/zesta/). |
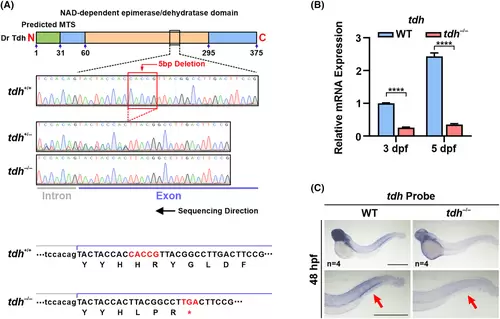
Construction of tdh−/− zebrafish line using CRISPR/Cas9 system. (A) Schematic diagram of the targeting strategy and validation of the result by genomic DNA sequencing. The mutant allele harbors a 5-bp deletion (red box) in the tdh locus that causes a premature stop codon occurred at H213 with three extra AAs. The sequenced region, containing intron and exon parts, is the gRNA-targeting region. Dr, Danio rerio; MTS, mitochondria targeting sequence; Tdh, l-threonine dehydrogenase. (B) RT-qPCR analysis of tdh mRNA expression in wild-type (WT) and tdh−/− embryos at 3 and 5 dpf. Data are presented as the mean ± SD of triplicate reactions; two-tailed t-test; ****P < 0.0001. (C) Whole-mount in situ hybridization (WISH) analysis of tdh mRNA expression in WT and tdh−/− embryos at 48 h post fertilization (hpf). The close-up view of the tail region is shown in the lower panels. Red arrows denote the caudal hematopoietic tissue (CHT) of WT or tdh−/− zebrafish. Scale bar = 500 μm. |
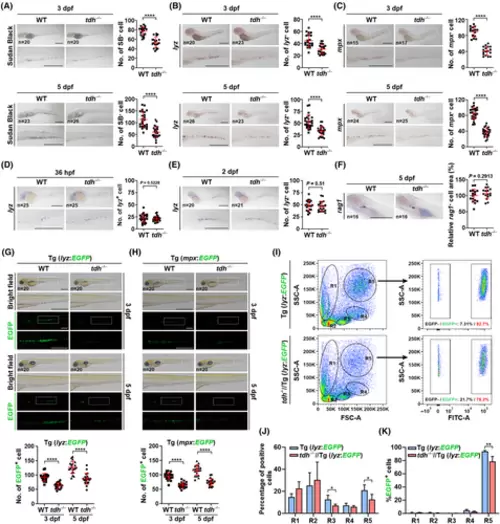
tdh knock-out reduces the number of neutrophils in CHT, which occurs from 3 dpf. (A) Sudan black (SB) staining of WT and tdh−/− embryos at 3 dpf (upper) and 5 dpf (bottom). (B, C) WISH analysis of lyz mRNA (B) or mpx mRNA (C) in CHT of WT and tdh−/− embryos at 3 dpf (upper) or 5 dpf (bottom). (D, E) WISH analysis of lyz mRNA in WT and tdh−/− embryos at 36 h post fertilization (hpf) (D) and 2 dpf (E). In (A) to (E), the close-up views are shown in the lower image and the quantification results are displayed on the right. (F) WISH analysis of rag1 mRNA in WT and tdh−/− embryos at 5 dpf. Areas of rag1+ cells were quantified by imagej, and the quantification results are shown on the right. (G, H) The brightfield and fluorescence microscopy images of WT and tdh−/− lines crossed with the transgenic (Tg) lines lyz:EGFP (G) or mpx:EGFP (H) at 3 and 5 dpf. A close-up view of boxed regions is shown in the lower panel. Quantification analysis results of numbers of EGFP+ cells in CHT are shown at the bottom. (I) FACS analysis of hematopoietic cells in the kidney marrow of WT//Tg (lyz:EGFP) and tdh−/−//Tg (lyz:EGFP) transgenic lines at 9 mpf. The right panels exemplify further analysis of the ratio of EGFP+ cells in the R5 gate. (J, K) Quantification analysis of the ratio R1 to R5 gates (J) and the ratio of EGFP+ cells in each gate (K) (n = 4, i.e. four WT and four tdh−/− fish kidneys were used for FACS analysis, each time 1 kidney for both genotypes). Scale bar = 500 μm in (A) to (H). Data are presented as the mean ± SD; two-tailed t-test; ****P < 0.0001; **P < 0.01; *P < 0.05. |
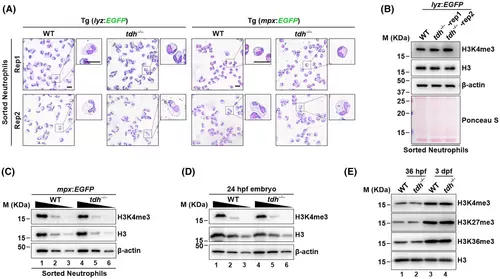
Loss of tdh does not affect neutrophil morphology and H3K4me3 levels in zebrafish. (A) Wright–Giemsa staining of neutrophils sorted from kidney marrow of the crossed transgenic (Tg) lines WT//Tg (lyz:EGFP) and tdh−/−//Tg (lyz:EGFP) (left) or WT//Tg (mpx:EGFP) and tdh−/−//Tg (mpx:EGFP) lines (right) at 7 months post fertilization (mpf). Scale bar = 10 μm. Rep1 and Rep2: two replications. (B) Immunoblot analysis of H3K4me3 levels in neutrophils that were sorted from the kidney marrow of WT//Tg (lyz:EGFP) and tdh−/−//Tg (lyz:EGFP) transgenic lines at 7 mpf. (C) Immunoblot analysis of H3K4me3 level in neutrophils sorted from kidney marrow of WT//Tg (mpx:EGFP) and tdh−/−//Tg (mpx:EGFP) transgenic line at 12 mpf. (D) Immunoblot analysis of H3K4me3 level of the whole embryo of WT and tdh−/− lines at 24 hpf. (E) Immunoblot analysis of H3K4me3, H3K27me3 and H3K36me3 levels in WT and tdh−/− embryos at 36 hpf and 3 dpf. For all immunoblot analyses, total H3 was used as a loading control. In (C) and (D), each sample was loaded in two-fold serial dilution for better quantification. |
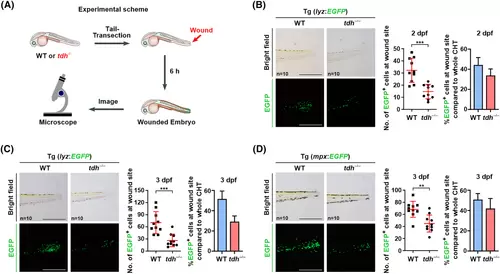
tdh knock-out slightly attenuates neutrophil migration induced upon acute injury. (A) Experimental scheme of the tail transection assay used in this study. (B, C) Left: brightfield and fluorescence microscopy images of the wound site of 2 dpf (B) or 3 dpf (C) WT//Tg (lyz:EGFP) and tdh−/−//Tg (lyz:EGFP) transgenic zebrafish embryos at 6 h post transection in the presence of N-phenylthiourea (PTU). Right: quantification analysis of EGFP+ cell numbers, and percentages of the EGFP+ cells in wound site compared to the whole CHT in WT//Tg (lyz:EGFP) and tdh−/−//Tg (lyz:EGFP) transgenic zebrafish embryos. (D) The same experiments were performed using the WT//Tg (mpx:EGFP) and tdh−/−//Tg (mpx:EGFP) transgenic zebrafish embryos in the absence of PTU. Scale bar = 500 μm in (B) to (D). Data are presented as the mean ± SD; two-tailed t-test; ***P < 0.001; **P < 0.01. |
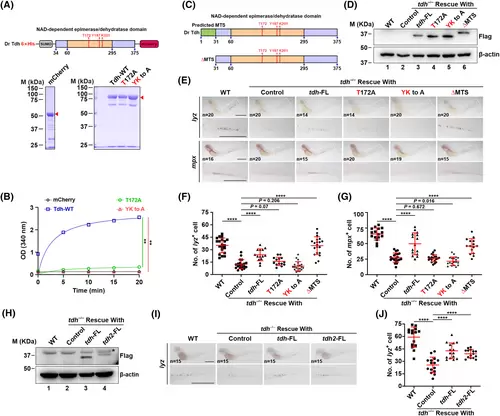
The reduction of neutrophils is dependent on Tdh enzymatic activity. (A) Purification of the WT and mutant Tdh proteins for enzymatic activity assay. The Tdh proteins were tagged with His-SUMO in the N-terminus and mCherry in the C-terminus, and purified from E. coil by the His-SUMO tag; mCherry protein was used as a negative control. The red triangles denote the target protein bands stained with Coomassie blue in gel. (B) Results of Tdh enzymatic activity assay in vitro. Purified proteins were added in 100 μL of reaction buffer (containing 50 mm NaCl, 100 mm Tris-HCl pH 8.0, 25 mm threonine and 5 mm NAD+) to a final concentration of 100 nm. Absorbance at 340 nm was detected every 5 min at 25 °C to monitor the conversion of NAD+ to NADH. Note that T172A or YK to A mutation almost entirely abolished its enzymatic activity in vitro compared to WT. Data are presented as the mean ± SD of triplicate reactions; two-tailed t-test; **P < 0.01. (C) Domain architecture of full-length and MTS deletion mutant (ΔMTS) Tdh proteins. (D) Immunoblot analysis of exogenous Tdh protein expression levels in tdh−/− embryos after injection with WT or different mutant tdh mRNAs. The total protein was extracted at 3 dpf and β-actin was used as a loading control. (E) WISH analysis of lyz and mpx mRNA at 3 dpf in CHT of WT and tdh−/− embryos after injection with WT or different mutant tdh mRNAs including two catalytically inactive mutants (T172A and YK to A) and the ΔMTS mutant. A close-up view of boxed regions is showen in the lower panel. (F) Quantification analysis of lyz+ cell numbers in CHT in (E). (G) Quantification analysis of mpx+ cell numbers in CHT in (E). (H) Immunoblot analysis of Tdh and Tdh2 protein expression levels in tdh−/− embryos after injection with tdh or tdh2 mRNA. The total protein was extracted at 3 dpf and β-actin was used as a loading control. *Unspecific band. (I) WISH analysis of lyz mRNA at 3 dpf in CHT of WT and tdh−/− embryos after injection with full-length tdh or tdh2 mRNA. A close-up view of boxed regions is shown in the lower panel. (J) Quantification analysis of lyz+ cell numbers in CHT in (I). Scale bar = 500 μm in (E) and (I). Data are presented as the mean ± SD; two-tailed t-test; ****P < 0.0001; **P < 0.01. |
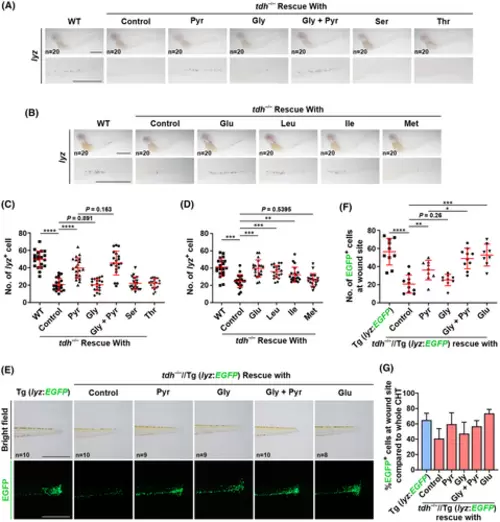
Supplement of metabolites that are able to produce acetyl-CoA significantly recovered the neutrophil numbers and migration toward wound in tdh−/− embryos. (A, B) Whole-mount in situ hybridization (WISH) analysis of lyz mRNA in CHT of WT and tdh−/− embryos treated with different metabolites at 3 dpf. A close-up view of boxed regions is shown in the lower panel. (C) The quantification analysis of the lyz+ cell numbers in CHT in (A). Note that only supplementation with Pyr largely recovered the number of neutrophils. (D) The quantification analysis of the lyz+ cell numbers in CHT in (B). Note that only supplementation with nutrients that are able to produce energy largely recovered the number of neutrophils. (E) Brightfield and fluorescent microscopy images of the wound site of 3 dpf WT//Tg (lyz:EGFP) and tdh−/−//Tg (lyz:EGFP) transgenic zebrafish embryos treated with different metabolites at 6 h post transection. (F, G) Quantification analysis of numbers of EGFP+ cell (F) and percentages of EGFP+ cells in wound site compared to the whole CHT in the WT//Tg (lyz:EGFP) and tdh−/−//Tg (lyz:EGFP) transgenic zebrafish embryos (G) (n = 5). Note that, supplementation with Pyr alone or with Glu efficiently rescued the migration defect of neutrophil. Glu, glucose; Gly, glycine; Ile, isoleucine; Leu, leucine; Met, methionine; Pyr, pyruvate; Ser, serine; Thr, threonine. Embryos were replenished with indicated metabolites at 24 h post fertilization (hpf) and culture media were refreshed every 24 h. Scale bar = 500 μm. Data are presented as the mean ± SD; two-tailed t-test; ****P < 0.0001; ***P < 0.001; **P < 0.01; *P < 0.05. |