
|
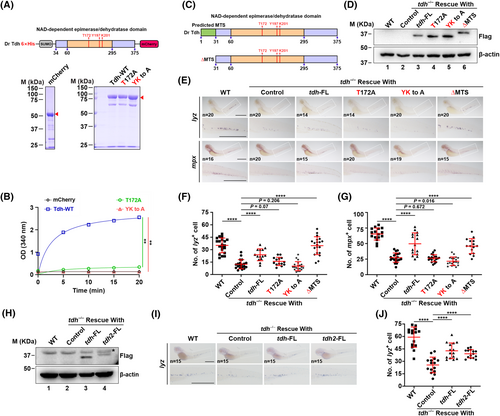
Fig. 6 The reduction of neutrophils is dependent on Tdh enzymatic activity. (A) Purification of the WT and mutant Tdh proteins for enzymatic activity assay. The Tdh proteins were tagged with His-SUMO in the N-terminus and mCherry in the C-terminus, and purified from E. coil by the His-SUMO tag; mCherry protein was used as a negative control. The red triangles denote the target protein bands stained with Coomassie blue in gel. (B) Results of Tdh enzymatic activity assay in vitro. Purified proteins were added in 100 μL of reaction buffer (containing 50 mm NaCl, 100 mm Tris-HCl pH 8.0, 25 mm threonine and 5 mm NAD+) to a final concentration of 100 nm. Absorbance at 340 nm was detected every 5 min at 25 °C to monitor the conversion of NAD+ to NADH. Note that T172A or YK to A mutation almost entirely abolished its enzymatic activity in vitro compared to WT. Data are presented as the mean ± SD of triplicate reactions; two-tailed t-test; **P < 0.01. (C) Domain architecture of full-length and MTS deletion mutant (ΔMTS) Tdh proteins. (D) Immunoblot analysis of exogenous Tdh protein expression levels in tdh−/− embryos after injection with WT or different mutant tdh mRNAs. The total protein was extracted at 3 dpf and β-actin was used as a loading control. (E) WISH analysis of lyz and mpx mRNA at 3 dpf in CHT of WT and tdh−/− embryos after injection with WT or different mutant tdh mRNAs including two catalytically inactive mutants (T172A and YK to A) and the ΔMTS mutant. A close-up view of boxed regions is showen in the lower panel. (F) Quantification analysis of lyz+ cell numbers in CHT in (E). (G) Quantification analysis of mpx+ cell numbers in CHT in (E). (H) Immunoblot analysis of Tdh and Tdh2 protein expression levels in tdh−/− embryos after injection with tdh or tdh2 mRNA. The total protein was extracted at 3 dpf and β-actin was used as a loading control. *Unspecific band. (I) WISH analysis of lyz mRNA at 3 dpf in CHT of WT and tdh−/− embryos after injection with full-length tdh or tdh2 mRNA. A close-up view of boxed regions is shown in the lower panel. (J) Quantification analysis of lyz+ cell numbers in CHT in (I). Scale bar = 500 μm in (E) and (I). Data are presented as the mean ± SD; two-tailed t-test; ****P < 0.0001; **P < 0.01.