
|
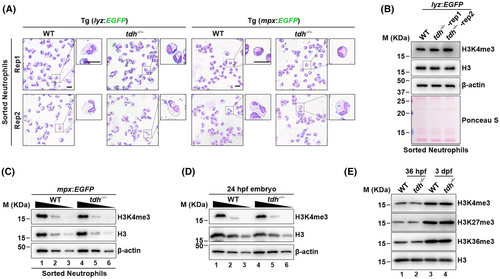
Fig. 4 Loss of tdh does not affect neutrophil morphology and H3K4me3 levels in zebrafish. (A) Wright–Giemsa staining of neutrophils sorted from kidney marrow of the crossed transgenic (Tg) lines WT//Tg (lyz:EGFP) and tdh−/−//Tg (lyz:EGFP) (left) or WT//Tg (mpx:EGFP) and tdh−/−//Tg (mpx:EGFP) lines (right) at 7 months post fertilization (mpf). Scale bar = 10 μm. Rep1 and Rep2: two replications. (B) Immunoblot analysis of H3K4me3 levels in neutrophils that were sorted from the kidney marrow of WT//Tg (lyz:EGFP) and tdh−/−//Tg (lyz:EGFP) transgenic lines at 7 mpf. (C) Immunoblot analysis of H3K4me3 level in neutrophils sorted from kidney marrow of WT//Tg (mpx:EGFP) and tdh−/−//Tg (mpx:EGFP) transgenic line at 12 mpf. (D) Immunoblot analysis of H3K4me3 level of the whole embryo of WT and tdh−/− lines at 24 hpf. (E) Immunoblot analysis of H3K4me3, H3K27me3 and H3K36me3 levels in WT and tdh−/− embryos at 36 hpf and 3 dpf. For all immunoblot analyses, total H3 was used as a loading control. In (C) and (D), each sample was loaded in two-fold serial dilution for better quantification.