
Fig. 3
- ID
- ZDB-FIG-240806-3
- Publication
- Li et al., 2024 - Threonine dehydrogenase regulates neutrophil homeostasis but not H3K4me3 levels in zebrafish
- Other Figures
- All Figure Page
- Back to All Figure Page
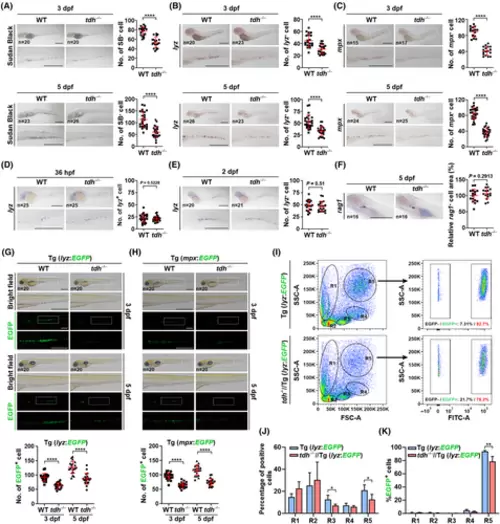
tdh knock-out reduces the number of neutrophils in CHT, which occurs from 3 dpf. (A) Sudan black (SB) staining of WT and tdh−/− embryos at 3 dpf (upper) and 5 dpf (bottom). (B, C) WISH analysis of lyz mRNA (B) or mpx mRNA (C) in CHT of WT and tdh−/− embryos at 3 dpf (upper) or 5 dpf (bottom). (D, E) WISH analysis of lyz mRNA in WT and tdh−/− embryos at 36 h post fertilization (hpf) (D) and 2 dpf (E). In (A) to (E), the close-up views are shown in the lower image and the quantification results are displayed on the right. (F) WISH analysis of rag1 mRNA in WT and tdh−/− embryos at 5 dpf. Areas of rag1+ cells were quantified by imagej, and the quantification results are shown on the right. (G, H) The brightfield and fluorescence microscopy images of WT and tdh−/− lines crossed with the transgenic (Tg) lines lyz:EGFP (G) or mpx:EGFP (H) at 3 and 5 dpf. A close-up view of boxed regions is shown in the lower panel. Quantification analysis results of numbers of EGFP+ cells in CHT are shown at the bottom. (I) FACS analysis of hematopoietic cells in the kidney marrow of WT//Tg (lyz:EGFP) and tdh−/−//Tg (lyz:EGFP) transgenic lines at 9 mpf. The right panels exemplify further analysis of the ratio of EGFP+ cells in the R5 gate. (J, K) Quantification analysis of the ratio R1 to R5 gates (J) and the ratio of EGFP+ cells in each gate (K) (n = 4, i.e. four WT and four tdh−/− fish kidneys were used for FACS analysis, each time 1 kidney for both genotypes). Scale bar = 500 μm in (A) to (H). Data are presented as the mean ± SD; two-tailed t-test; ****P < 0.0001; **P < 0.01; *P < 0.05. |