
- Title
-
Laboratory Course Using Zebrafish to Uncover Changing Roles of Wnt Signaling in Early Vertebrate Development
- Authors
- Fiegl, M., Kimmel, R.A.
- Source
- Full text @ Zebrafish
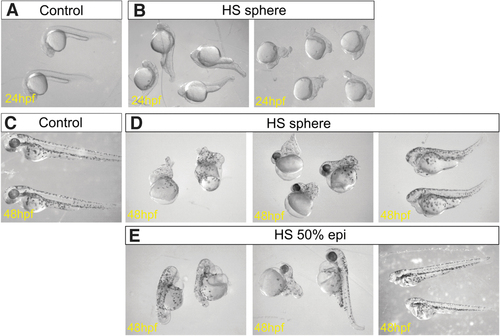
Phenotypes of hsp:wnt8 transgenic embryos. (A, B) Brightfield images at 24 hpf of control (A) and hsp:wnt8 embryos HS at sphere stage (B). (C–E) Brightfield images at 48 hpf of control (C) and hsp:wnt8 embryos that received a HS at sphere stage (D) and at 50% epiboly (E). hpf, hours postfertilization; HS, heat shocked. |
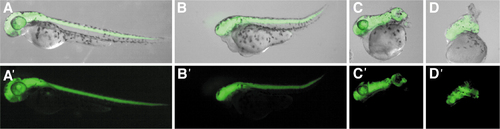
Neurod:EGFP transgene expression at 48 hpf in hsp:wnt8 embryos HS at sphere stage. (A) Control embryos in which GFP (green) is expressed in the head and central nervous system. A range of phenotypes was seen in HS embryos (B, D). GFP expression delineates a shortened trunk and absence of eyes (B), and a severely shortened and twisted posterior axis (C). In an embryo without discernible structures, GFP expression shows evidence for neural induction (D). (in A′–D′, the GFP signal is shown without brightfield). GFP. |
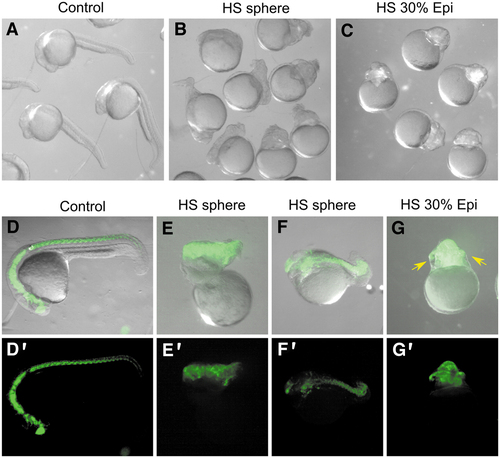
Reduced posterior extension in HS hsp:Axin1 transgenic embryos. (A, B) Brightfield images at 24 hpf of control (A) and hsp:Axin1 embryos that received a HS at sphere stage (B) and at 30% epiboly (C). (D–G) neurod:GFP with brightfield overlay of control embryos (D) or hsp:Axin1 embryos treated with HS as indicated (E–G). (D′–G′) Neurod: GFP channel shown alone. Eye formation was evident in severely truncated embryos (G, yellow arrows). |
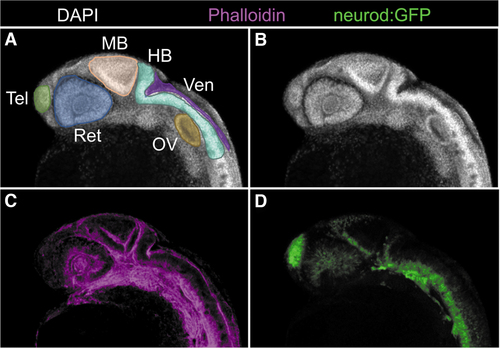
CNS morphology revealed by DAPI (gray) and phalloidin (magenta) staining, and neurod:GFP (green) at 24 hpf. (A, B) Nuclear staining highlights anterior structures. Phalloidin staining further outlines structures (C), complementing information provided by transgenes such as neurod:GFP (green, D). CNS; DAPI; HB, hindbrain; MB, midbrain; OV, otic vesicle; Ret, retina; Tel, telencephalon; Ven, hindbrain ventricle. |
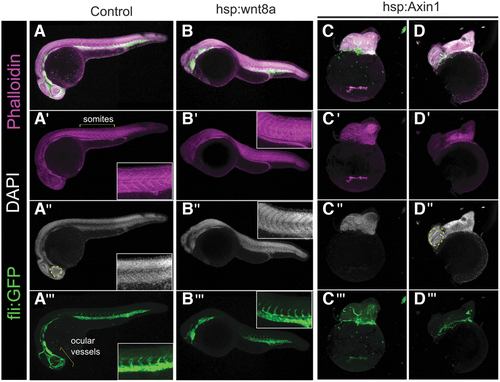
Student-generated confocal images of 24 hpf embryos following Wnt pathway manipulation. Top row, merged images of DAPI (gray), Phalloidin (magenta) and fli:GFP (green), A′–D‴ individual channels of control (A), HS hsp:wnt8a (B), and HS hsp:Axin1 (C, D). HS was performed for 40 min at 37 degrees starting at sphere stage (B, D) or 1000–2000 cell (3 hpf) stage (C). Wnt overexpression reduces eye development, and accompanying ocular vessels are absent (A‴, bracket vs. B‴). Inset highlights trunk tissue patterning based on phalloidin (A′, B′) nuclear staining (A″, B″) and intersegmental vessel outgrowth (A‴, B‴). Wnt inhibition causes increased size of eye (yellow dashed outline, A″ vs. D″) and disrupts posterior axis outgrowth (C, D). Figure “A” is a stitched image of two partially overlapping images (see Materials and Methods section for details). |
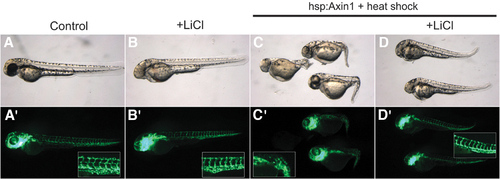
Partial reversal of Wnt phenotypes with opposing treatments (student images). LiCl treatment at sphere stage leads to reduction of anterior structures, including the eye (A vs. B). HS induction of hsp:Axin1 expression causes anterior enlargement and posterior trunk defects (A vs. C). With expression of Axin1 after LiCl treatment, eye development is disrupted while trunk defects are milder (D vs. B, C). (26/33 embryos had nearly normal axis formation, 6/33 showed a bent or truncated axis, 1 embryo was severely deformed.) Fli:GFP delineates the ocular region (A′, C′) and its absence (B′, D′), and indicates mild (B′, D′ vs. A′) and severe (C′ vs. A′) perturbation of trunk vessel patterning. |

Evaluation by students. (A) Positive aspects of the course reported in a free-response survey (n = 14). (B) Learning outcomes as perceived by the students, rated as to a large gain (gray bar), moderate (mod) gain (orange bar), or no gain (tan bar) (n = 6). |