FIGURE SUMMARY
Title

col1a2+ fibroblasts/muscle progenitors finetune xanthophore countershading by differentially expressing csf1a/1b in embryonic zebrafish

Authors
Chen, J., Wang, H., Wu, S., Zhang, A., Qiu, Z., Huang, P., Qu, J.Y., Xu, J.
Source
Full text @ Sci Adv

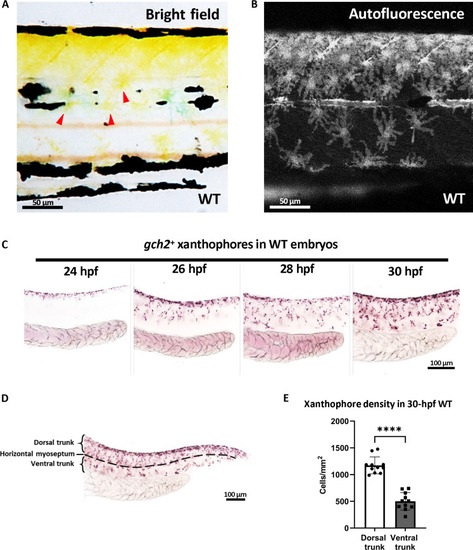
Xanthophore countershading in embryonic zebrafish.

(A and B) Lateral views of 3-dpf zebrafish trunks. Red arrowheads indicated the differentiated xanthophores (A). Autofluorescent xanthophores on 3-dpf zebrafish trunks (B). More xanthophores reside at the dorsum than the ventrum. (C) Whole-mount in situ hybridization (WISH) staining at serial stages shows the gch2+ xanthoblasts migration begins at 24 hpf and finishes at 30 hpf. (D) Schematic diagram of the xanthoblasts/xanthophores counting region. The horizontal myoseptum is indicated by the black dotted line. (E) Quantification of gch2+ xanthophores density in the dorsal and ventral trunks, respectively. n = 9 for each group. Unpaired Student’s t tests were used to calculate the P value. Two-tailed P values are used. Error bars represent means ± SD. ****P < 0.0001. WT, wild type.

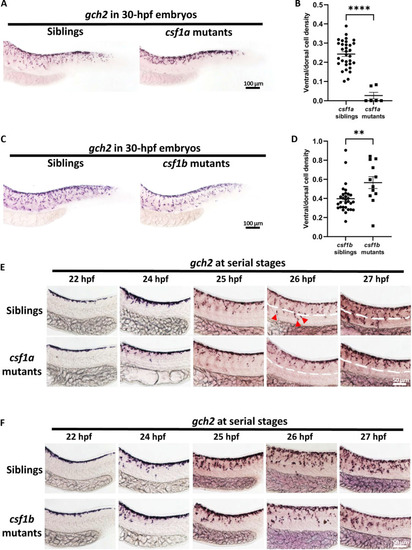
Xanthophore countershading is abnormal in csf1a and csf1b mutants.

(A and B) Representative images (A) and quantification (B) of xanthophores in csf1a siblings (n = 32) and mutants (n = 6). Xanthophores are indicated by WISH staining of gch2. Unpaired Student’s t tests were used to calculate the P value. Two-tailed P values are used. Error bars represent means ± SD. ****P < 0.0001. (C and D) Representative images (C) and quantification (D) of xanthophores in csf1b siblings (n = 30) and mutants (n = 12). Xanthophores are indicated by WISH staining of gch2. Unpaired Student’s t tests were used to calculate the P value. Two-tailed P values are used. Error bars represent means ± SD. ns, P > 0.05; **P < 0.01. (E) WISH staining at serial stages shows that xanthoblasts in csf1a mutants fail to cross the horizontal myoseptum at about 26 hpf. The horizontal myoseptum is indicated by the white dotted line. (F) WISH staining at serial stages shows that xanthoblasts in csf1b mutants migrate normally toward the ventrum.

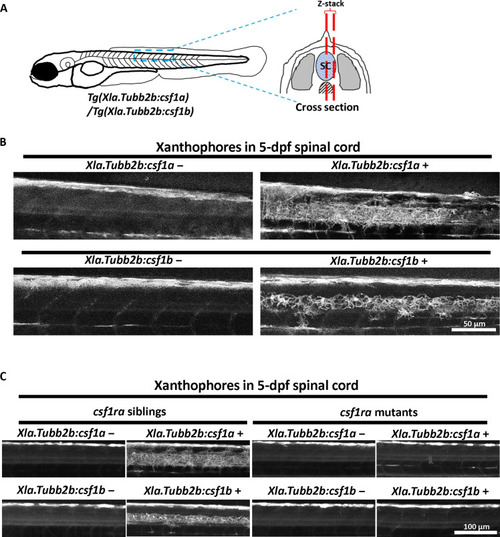
Csf1a and Csf1b are chemoattractants of xanthophores.

(A) Schematic diagram of the imaging region. Blue dashed lines represent the imaging area at the dorsal trunk. Red dashed lines indicate the Z-stack range of confocal microscopy at spinal cord. SC, spinal cord. (B) Representative images of autofluorescent xanthophores at spinal cord region in 5-dpf larvae with (right) and without (left) Tg(Xla.Tubb2b:csf1a)/Tg(Xla.Tubb2b:csf1b). Xanthophores are found in the spinal cord region of transgenic larvae. (C) Transgenic and nontransgenic csf1ra mutants or siblings are imaged at 5 dpf to observe autofluorescent xanthophore. Images show spinal cord regions in respective groups.

<italic toggle='yes'>csf1a</italic> and <italic toggle='yes'>csf1b</italic> are differentially expressed in the myotome and myoseptum during xanthophores pattern formation.

(A) Representative images of RNAscope detecting csf1a RNA granules at 20, 22, 24, 26, and 30 hpf, respectively. Trunk region is indicated by the long dashed lines. Dotted lines indicate the horizontal and vertical myoseptum. (B) Representative images of RNAscope detecting csf1b RNA granules at 20, 22, 24, 26, and 30 hpf, respectively. Trunk region is indicated by the long dashed lines. Dotted lines indicate the horizontal and vertical myoseptum.

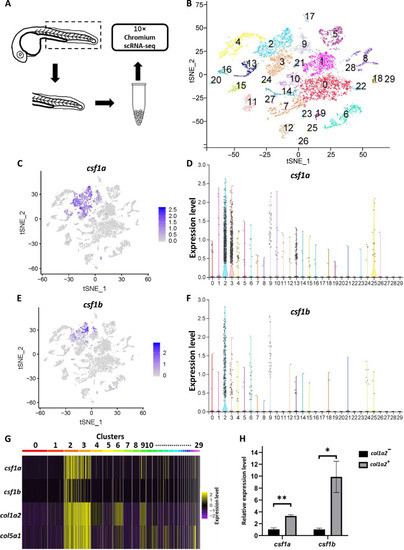
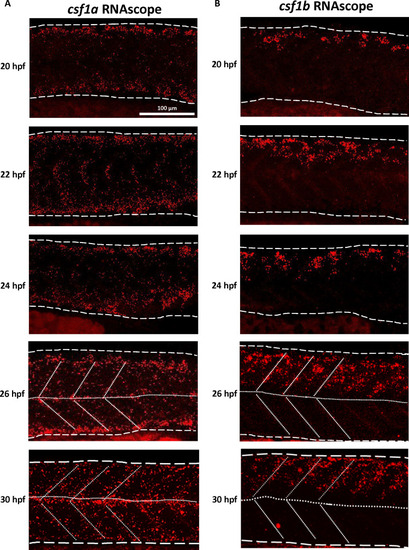
scRNA-seq reveals the sources of Csf1a and Csf1b in embryonic zebrafish.

(
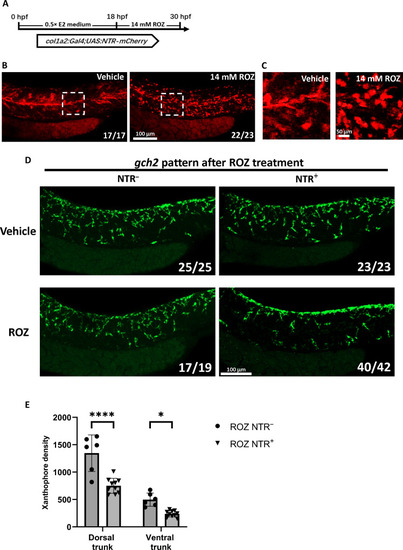
A) Scheme of the sample preparation workflow. Trunks of 27- to 28-hpf embryos were dissected and dissociated into single cells. (B) Clustering of the single-cell transcriptome results in 30 clusters (label with different colors and no. 0 to 29). (C and D) Expression analysis of csf1a in t-SNE plot (C) and violin plot (D). The results showed that csf1a expression is largely restricted to cells in clusters 2 and 3. (E and F) Expression analysis of csf1b in t-SNE plot (E) and violin plot (F). The results showed that csf1b expression is largely restricted to cells in cluster 2. (G) Heatmap of normalized differentially expressed genes: csf1a, csf1b, col1a2, and col5a1 in all 30 clusters. (H) Relative expression levels of csf1a and csf1b in Col1a2+ and Col1a2 cells, respectively. Col1a2+ and Col1a2 cells (n = 50,000, respectively) were sorted from Tg (col1a2: Gal4; UAS: NTR-mCherry). Data represented four independent experiments. Error bars represent mean ± SD. Unpaired, two-tailed t test was performed to determine significance. *P < 0.05 and **P < 0.01.

Ablation of col1a2+ fibroblast and muscle progenitors disrupts the xanthophore countershading in embryonic zebrafish.

(A) Scheme of ROZ treatment workflow. (B) Representative images of col1a2+ cells after ROZ treatment. Data are representative of the majority of embryos analyzed (proportion indicated lower right of each panel). col1a2+ cells are indicated by Tg (col1a2: Gal4;UAS:NTR-mCherry)(red). (C) Magnified images of white dashed box in (B). (D) Representative images of gch2 fluorescent in situ hybridization (FISH) after ROZ treatment. Data are representative of the majority of embryos analyzed (proportion indicated lower right of each panel). (E) Quantification of xanthophores density in ROZ-treated embryos with NTR transgene (n = 10) and without NTR transgene (n = 6). Xanthophores are indicated by FISH staining of gch2. Significances were calculated using two-way analysis of variance (ANOVA) followed by Sidak’s multiple comparisons test and Tukey’s multiple comparisons test. Error bars represent means ± SD. *P < 0.05 and ****P < 0.0001.

Acknowledgments
This image is the copyrighted work of the attributed author or publisher, and ZFIN has permission only to display this image to its users. Additional permissions should be obtained from the applicable author or publisher of the image. Full text @ Sci Adv