FIGURE

Fig. 5.

ID
ZDB-FIG-240408-48
Publication
Chen et al., 2024 - col1a2+ fibroblasts/muscle progenitors finetune xanthophore countershading by differentially expressing csf1a/1b in embryonic zebrafish
Other Figures
All Figure Page
Back to All Figure Page
Fig. 5.

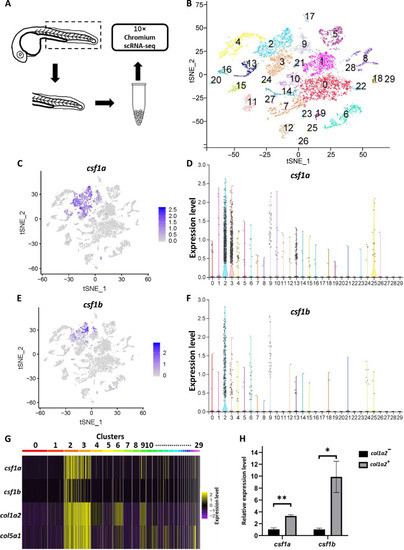
scRNA-seq reveals the sources of Csf1a and Csf1b in embryonic zebrafish.

(A) Scheme of the sample preparation workflow. Trunks of 27- to 28-hpf embryos were dissected and dissociated into single cells. (B) Clustering of the single-cell transcriptome results in 30 clusters (label with different colors and no. 0 to 29). (C and D) Expression analysis of csf1a in t-SNE plot (C) and violin plot (D). The results showed that csf1a expression is largely restricted to cells in clusters 2 and 3. (E and F) Expression analysis of csf1b in t-SNE plot (E) and violin plot (F). The results showed that csf1b expression is largely restricted to cells in cluster 2. (G) Heatmap of normalized differentially expressed genes: csf1a, csf1b, col1a2, and col5a1 in all 30 clusters. (H) Relative expression levels of csf1a and csf1b in Col1a2+ and Col1a2 cells, respectively. Col1a2+ and Col1a2 cells (n = 50,000, respectively) were sorted from Tg (col1a2: Gal4; UAS: NTR-mCherry). Data represented four independent experiments. Error bars represent mean ± SD. Unpaired, two-tailed t test was performed to determine significance. *P < 0.05 and **P < 0.01.

Expression Data

Expression Detail
Antibody Labeling
Phenotype Data

Phenotype Detail
Acknowledgments
This image is the copyrighted work of the attributed author or publisher, and ZFIN has permission only to display this image to its users. Additional permissions should be obtained from the applicable author or publisher of the image. Full text @ Sci Adv