IMAGE

Fig. 1.

ID
ZDB-IMAGE-240408-44
Source
Figures for Chen et al., 2024
Image
Figure Caption

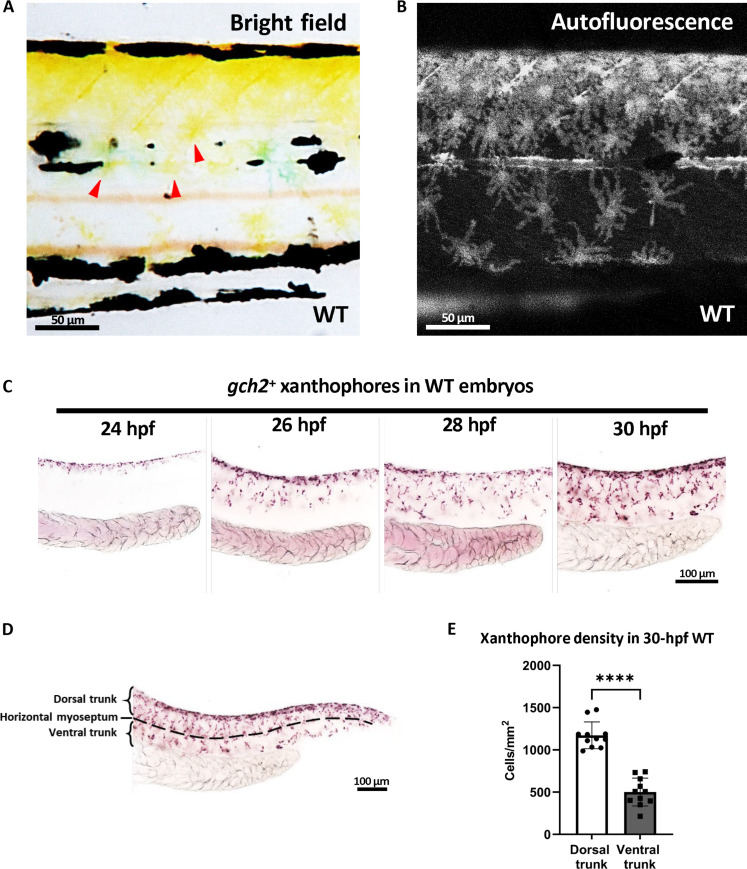
Fig. 1. Xanthophore countershading in embryonic zebrafish.

(A and B) Lateral views of 3-dpf zebrafish trunks. Red arrowheads indicated the differentiated xanthophores (A). Autofluorescent xanthophores on 3-dpf zebrafish trunks (B). More xanthophores reside at the dorsum than the ventrum. (C) Whole-mount in situ hybridization (WISH) staining at serial stages shows the gch2+ xanthoblasts migration begins at 24 hpf and finishes at 30 hpf. (D) Schematic diagram of the xanthoblasts/xanthophores counting region. The horizontal myoseptum is indicated by the black dotted line. (E) Quantification of gch2+ xanthophores density in the dorsal and ventral trunks, respectively. n = 9 for each group. Unpaired Student’s t tests were used to calculate the P value. Two-tailed P values are used. Error bars represent means ± SD. ****P < 0.0001. WT, wild type.

Acknowledgments
This image is the copyrighted work of the attributed author or publisher, and ZFIN has permission only to display this image to its users. Additional permissions should be obtained from the applicable author or publisher of the image. Full text @ Sci Adv