FIGURE

Fig. 6.

ID
ZDB-FIG-240408-49
Publication
Chen et al., 2024 - col1a2+ fibroblasts/muscle progenitors finetune xanthophore countershading by differentially expressing csf1a/1b in embryonic zebrafish
Other Figures
All Figure Page
Back to All Figure Page
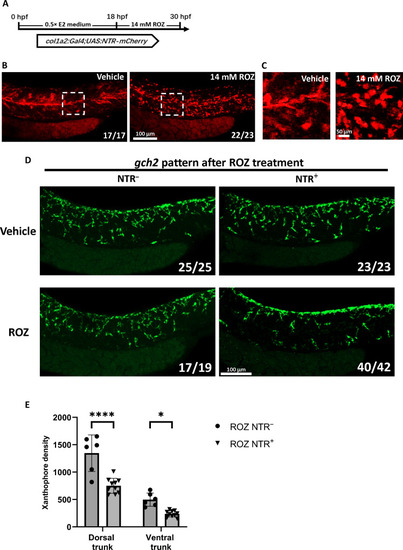
Fig. 6.

Ablation of col1a2+ fibroblast and muscle progenitors disrupts the xanthophore countershading in embryonic zebrafish.

(A) Scheme of ROZ treatment workflow. (B) Representative images of col1a2+ cells after ROZ treatment. Data are representative of the majority of embryos analyzed (proportion indicated lower right of each panel). col1a2+ cells are indicated by Tg (col1a2: Gal4;UAS:NTR-mCherry)(red). (C) Magnified images of white dashed box in (B). (D) Representative images of gch2 fluorescent in situ hybridization (FISH) after ROZ treatment. Data are representative of the majority of embryos analyzed (proportion indicated lower right of each panel). (E) Quantification of xanthophores density in ROZ-treated embryos with NTR transgene (n = 10) and without NTR transgene (n = 6). Xanthophores are indicated by FISH staining of gch2. Significances were calculated using two-way analysis of variance (ANOVA) followed by Sidak’s multiple comparisons test and Tukey’s multiple comparisons test. Error bars represent means ± SD. *P < 0.05 and ****P < 0.0001.

Expression Data

Expression Detail
Antibody Labeling
Phenotype Data

Phenotype Detail
Acknowledgments
This image is the copyrighted work of the attributed author or publisher, and ZFIN has permission only to display this image to its users. Additional permissions should be obtained from the applicable author or publisher of the image. Full text @ Sci Adv