
- Title
-
Comprehensive phenotypic characterization of an allelic series of zebrafish models of NEB-related nemaline myopathy
- Authors
- Fabian, L., Karimi, E., Farman, G.P., Gohlke, J., Ottenheijm, C.A.C., Granzier, H.L., Dowling, J.J.
- Source
- Full text @ Hum. Mol. Genet.
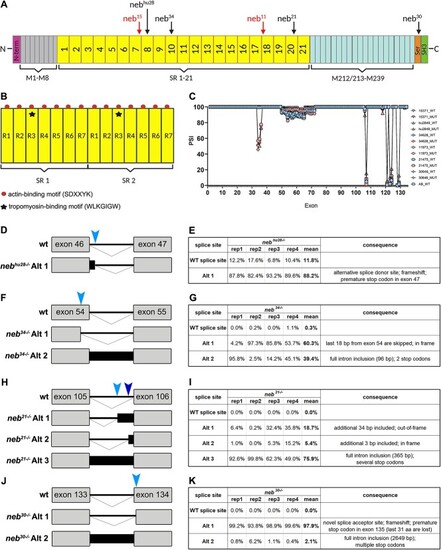
Zebrafish nebulin structure and nebulin mutations. (A) Diagram of zebrafish nebulin with position of mutations. N-terminus of nebulin consists of a glutamic acid rich sequence followed by several distinctive domains that mediate interactions with tropomodulin. Central region of nebulin has a repetitive, modular structure, and, in zebrafish, is organized into 21 super-repeats (SR). The C-terminus of nebulin consists of several linker modules, a serine-rich and an SH3 domains, which mediate interactions with proteins in the Z-disk. (B) Diagram of two SR. Each SR is made up of seven simple repeats (R1-R7) and contains a conserved WLKGIGW motif (troponin/tropomyosin binding site) in R3 (star). Each simple repeat contains an actin-binding motif (SDXXYK) (dots). (C) Percent spliced in index (PSI) showing alternative splicing in nebulin. Skipping of exons 33–37 was observed only in |
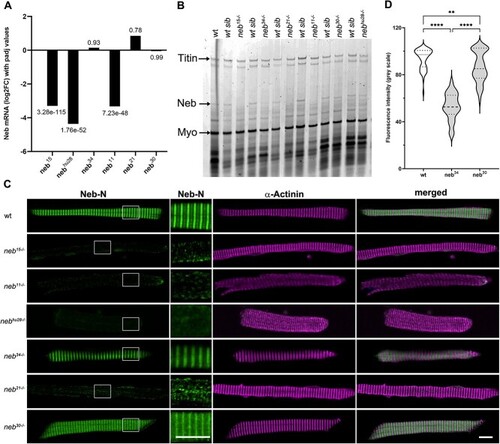
Nebulin expression is reduced in |
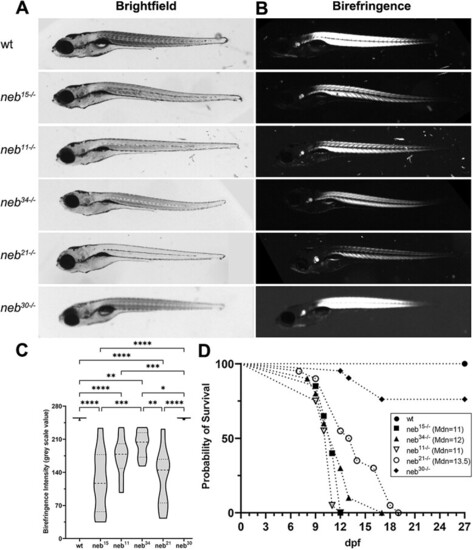
Morphological defects and early mortality in PHENOTYPE:
|
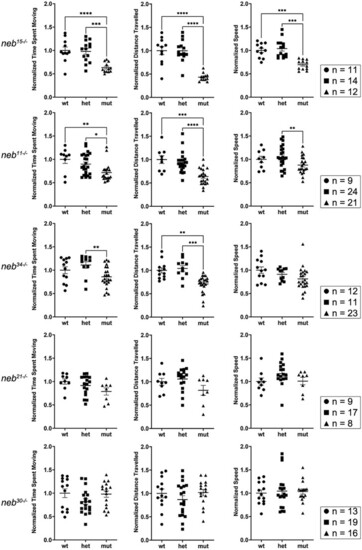
Swimming behaviour is defective in PHENOTYPE:
|
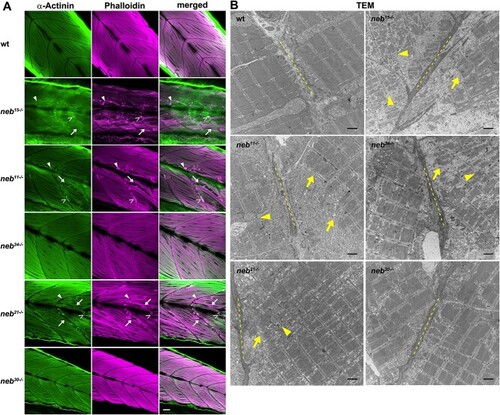
Muscle and sarcomere organization is defective in PHENOTYPE:
|
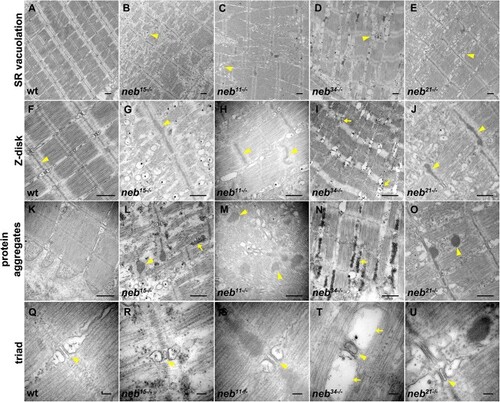
Details of ultrastructural defects in PHENOTYPE:
|
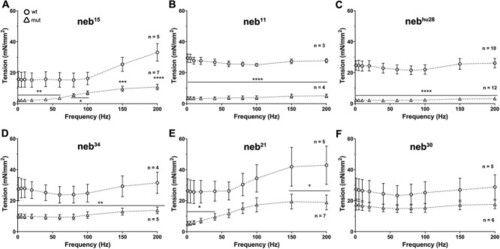
Force production is reduced in PHENOTYPE:
|
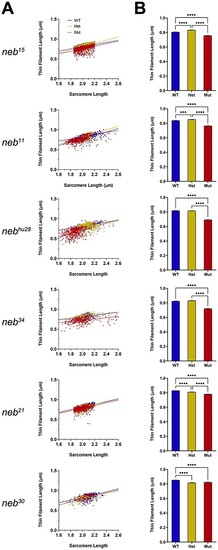
Thin filaments are shorter PHENOTYPE:
|
|