
Figure 2
- ID
- ZDB-IMAGE-240607-118
- Antibodies
- Publication
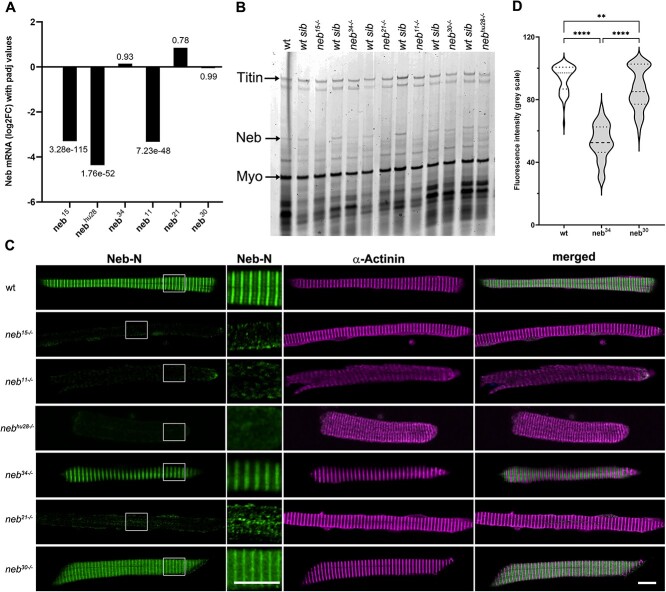
- Fabian et al., 2024 - Comprehensive phenotypic characterization of an allelic series of zebrafish models of NEB-related nemaline myopathy
- All Figures
- Figures for Fabian et al., 2024
|
Figure 2
Nebulin expression is reduced in