
- Title
-
A multistep computational approach reveals a neuro-mesenchymal cell population in the embryonic hematopoietic stem cell niche
- Authors
- Miladinovic, O., Canto, P.Y., Pouget, C., Piau, O., Radic, N., Freschu, P., Megherbi, A., Prats, C.B., Jacques, S., Hirsinger, E., Geeverding, A., Dufour, S., Petit, L., Souyri, M., North, T., Isambert, H., Traver, D., Jaffredo, T., Charbord, P., Durand, C.
- Source
- Full text @ Development
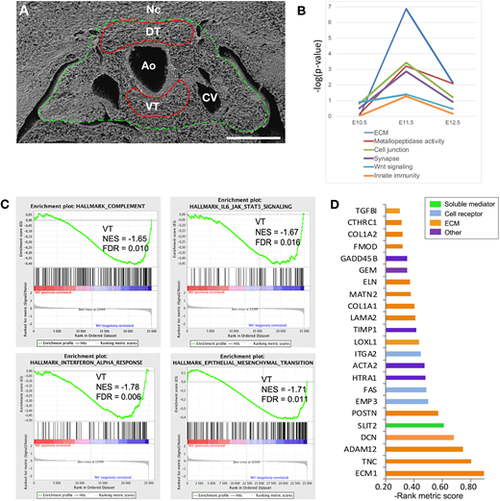
The dorsal and ventral aortic tissues exhibit distinct molecular signatures. (A) In a first experiment, E11.5 dorsal and ventral tissues (DT and VT) surrounding the aorta were isolated by laser microdissection (red lines) and used for bulk transcriptomics (microarrays). In a second experiment, E11.5 whole AGM regions were dissected (green line) and processed for single cell transcriptomics (scRNA-seq). Ao, aorta; CV, cardinal vein; Nc, notochord. Scale bar: 100 µm. (B) GO analysis using DAVID of DEGs comparing DT and VT at E10.5, E11.5 and E12.5. The graph indicates the main GO categories enriched in VT at E11.5. (C) GSEA showing four gene sets significantly enriched in VT at E11.5 (profiles are shifted to the right corresponding to the VT genes). FDR, false discovery rate; NES, normalized enrichment score. (D) Rank metric score of the 23 first genes from the ‘Epithelial_Mesenchymal_Transition’ gene set enriched in VT from panel C. |
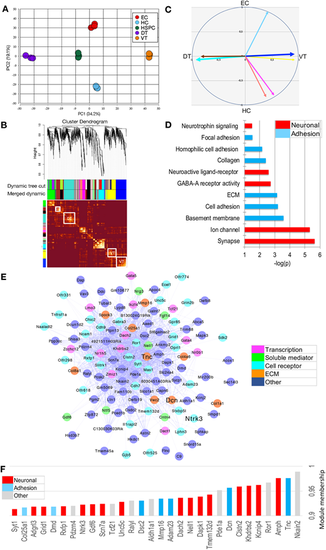
Correlation-based network analysis of mesenchyme-enriched genes discloses three major modules, one ventrally and two dorsally located. (A) PCA (using 2401 genes and 15 samples) highlighting the different clusters. The score plot of PC1 versus PC2 is shown. (B) Module detection using WGCNA. Modules named by colors correspond to squares along the diagonal of the topological overlap matrix plot shown below the clustering tree. Modules are defined in a first step according to the dynamic tree cut method, and in a second step according to the merged dynamic one. DT and VT modules are highlighted. (C) Module eigenvectors corresponding to the DT to VT (PC1 trait) and to the EC to HC (PC2 trait) contrasts. The vectors corresponding to the major DT and VT modules (‘turquoise’ and ‘blue’, respectively) are in thicker lines. (D) Significant GO categories corresponding to genes belonging to the major VT blue module. (E) Connectivity plot of the 119 most connected genes (out of a total of 295) belonging to the VT blue module. (F) Connectivity bar plot of the top-30 genes of the VT blue module |
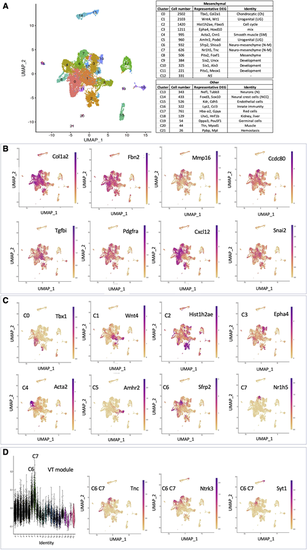
Single cell analysis (scRNA-seq) discloses a large and heterogeneous mesenchymal cell population. (A) Louvain clusters. Left panel: UMAP embedding. Right panels: cluster identities. (B) UMAP expression pattern of genes defining the mesenchymal cell population. (C) UMAP expression of the first-ranked DEG defining each of the eight major cell clusters of the mesenchymal population. (D) Distribution of the genes of the VT blue WGCNA module among the different clusters. Extreme left panel: projection of the VT module genes onto the Louvain clusters; most genes project onto the C6 and C7 clusters. Other three panels: example of UMAP expression patterns of genes belonging to that module. |
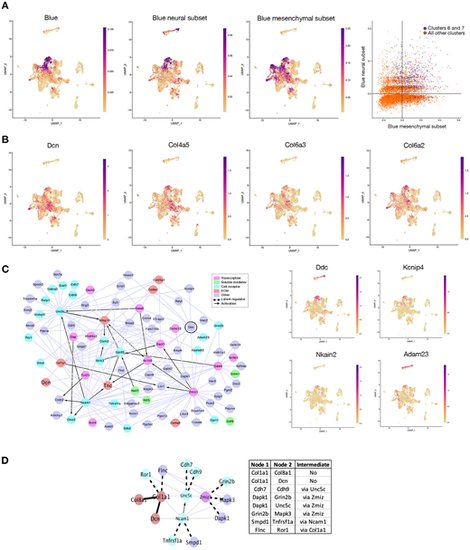
Gene set scoring and information-based network analysis indicate the presence of a ventrally located neuro-mesenchymal population. (A) Gene set scoring. Extreme left panel: UMAP expression pattern of the genes of the VT blue WGCNA module. Middle panels: UMAP expression patterns of the genes belonging to the neuronal and mesenchymal subsets extracted from that module. Extreme right panel: superimposition of the genes of the neuronal and mesenchymal subsets; the cells expressing both neuronal and mesenchymal genes are represented in purple. (B) UMAP expression pattern of individual ECM genes belonging to the VT blue mesenchymal subset. (C) Information-based network. Left panel: miic plot of the 89 central core genes of the VT blue module. Right panel: UMAP expression patterns for Ddc (encircled on the miic plot) and of three of its connected genes. (D) Analysis of protein-protein interactions using STRING. Direct STRING interactions are indicated by continuous thick black lines and indirect ones by dashed thick black lines. The thin purple lines represent the remaining miic interactions not found using STRING. The table indicates the STRING interactions and the intermediate nodes if any. |
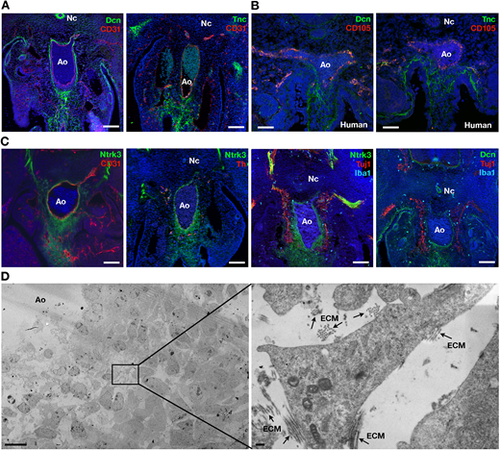
Morphological studies confirm the existence of a subaortic neuro-mesenchymal population. (A) Immunodetection of Dcn, Tnc and CD31 on E11.5 mouse embryo sections. (B) Immunodetection of Dcn, Tnc and CD105 on day 30 human embryo sections. (C) Immunodetection of Ntrk3, CD31, Th, Tuj1, Iba1 and Dcn on E11.5 mouse embryo sections. Unmerged images are shown in Fig. S7. (D) Transmission electron microscopy of E11.5 subaortic tissue. The image on the right is a magnification of the boxed area in the left panel. Arrows indicate areas of extracellular matrix (ECM). Ao, dorsal aorta; Nc, notochord. Scale bars: 100 µm (A,C); 50 µm (B); 10 µm (D, left); 200 nm (D, right) |
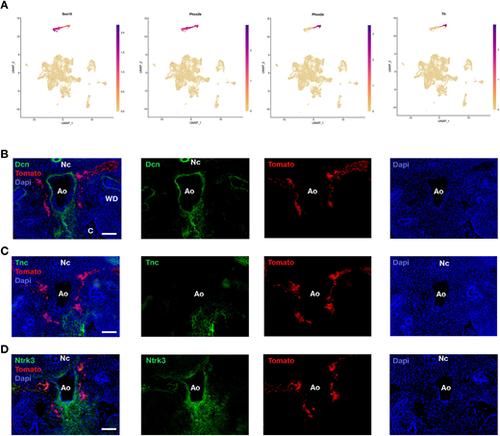
The E11.5 subaortic neuro-mesenchyme does not derive from NCCs. (A) UMAP expression pattern of NCC markers Sox10, Phox2b, Phox2a and Th. (B-D) Immunodetection of Dcn (B), Tnc (C) and Ntrk3 (D) on E11.5 sections of HtPA-Cre; R26R-Tomato mouse embryos. Ao, dorsal aorta; C, coelom; Nc, notochord; WD, Wolffian duct. Scale bars: 100 µm |
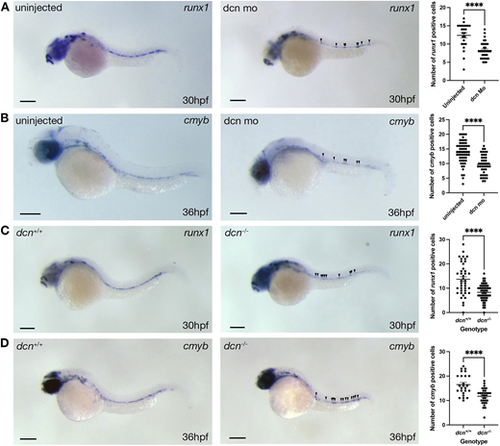
Loss-of-function experiments in the zebrafish confirm the essential role of the characteristic ECM component Dcn for HSPC development. (A) WISH for runx1 in 30 hpf dcn morphants (MOSTART) and their respective uninjected controls. Right panel indicates the numbers of runx1+ cells in the dorsal aorta of control and dcn morphant embryos. (B) WISH for cmyb in 36 hpf dcn morphants (MOSTART) and their respective uninjected controls. Right panel indicates the numbers of cmyb+ cells in the dorsal aorta of control and dcn morphant embryos. (C) WISH for runx1 in 30 hpf dcn+/+ and dcn−/− embryos. Right panel indicates the numbers of runx1+ cells in the dorsal aorta of dcn+/+ and dcn−/− embryos. (D) WISH for cmyb in 36 hpf dcn+/+ and dcn−/− embryos. Right panel indicates the numbers of cmyb+ cells in the dorsal aorta of dcn+/+ and dcn−/− embryos. ****P<0.0001 using either a two-tailed unpaired t-test or a Mann–Whitney test (24-57 embryos were analyzed for each condition, from 1-3 independent experiments). Arrowheads indicate HSPCs. Data are mean±s.e.m. Scale bars: 300 µm. |