
Fig. 1
- ID
- ZDB-IMAGE-240515-7
- Publication
- Miladinovic et al., 2024 - A multistep computational approach reveals a neuro-mesenchymal cell population in the embryonic hematopoietic stem cell niche
- All Figures
- Figures for Miladinovic et al., 2024
|
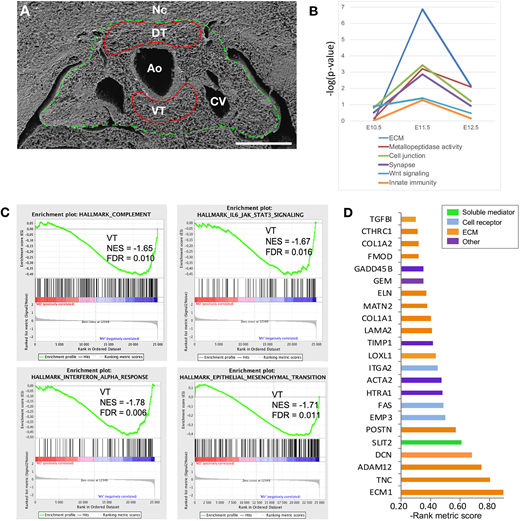
Fig. 1 The dorsal and ventral aortic tissues exhibit distinct molecular signatures. (A) In a first experiment, E11.5 dorsal and ventral tissues (DT and VT) surrounding the aorta were isolated by laser microdissection (red lines) and used for bulk transcriptomics (microarrays). In a second experiment, E11.5 whole AGM regions were dissected (green line) and processed for single cell transcriptomics (scRNA-seq). Ao, aorta; CV, cardinal vein; Nc, notochord. Scale bar: 100 µm. (B) GO analysis using DAVID of DEGs comparing DT and VT at E10.5, E11.5 and E12.5. The graph indicates the main GO categories enriched in VT at E11.5. (C) GSEA showing four gene sets significantly enriched in VT at E11.5 (profiles are shifted to the right corresponding to the VT genes). FDR, false discovery rate; NES, normalized enrichment score. (D) Rank metric score of the 23 first genes from the ‘Epithelial_Mesenchymal_Transition’ gene set enriched in VT from panel C.