
Fig. 3
- ID
- ZDB-FIG-240515-9
- Publication
- Miladinovic et al., 2024 - A multistep computational approach reveals a neuro-mesenchymal cell population in the embryonic hematopoietic stem cell niche
- Other Figures
- All Figure Page
- Back to All Figure Page
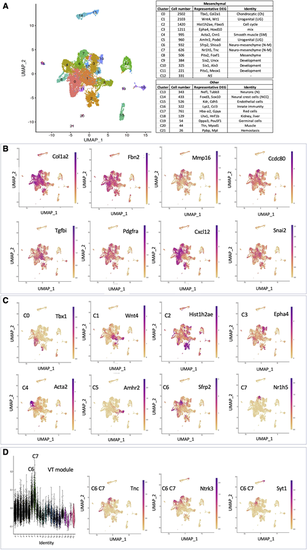
Single cell analysis (scRNA-seq) discloses a large and heterogeneous mesenchymal cell population. (A) Louvain clusters. Left panel: UMAP embedding. Right panels: cluster identities. (B) UMAP expression pattern of genes defining the mesenchymal cell population. (C) UMAP expression of the first-ranked DEG defining each of the eight major cell clusters of the mesenchymal population. (D) Distribution of the genes of the VT blue WGCNA module among the different clusters. Extreme left panel: projection of the VT module genes onto the Louvain clusters; most genes project onto the C6 and C7 clusters. Other three panels: example of UMAP expression patterns of genes belonging to that module. |