
Fig. 4
- ID
- ZDB-FIG-240515-10
- Publication
- Miladinovic et al., 2024 - A multistep computational approach reveals a neuro-mesenchymal cell population in the embryonic hematopoietic stem cell niche
- Other Figures
- All Figure Page
- Back to All Figure Page
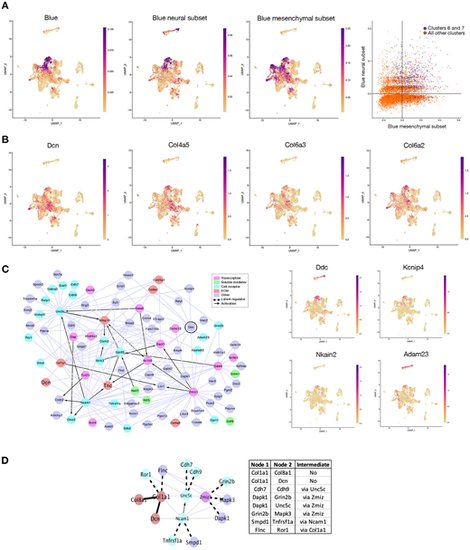
Gene set scoring and information-based network analysis indicate the presence of a ventrally located neuro-mesenchymal population. (A) Gene set scoring. Extreme left panel: UMAP expression pattern of the genes of the VT blue WGCNA module. Middle panels: UMAP expression patterns of the genes belonging to the neuronal and mesenchymal subsets extracted from that module. Extreme right panel: superimposition of the genes of the neuronal and mesenchymal subsets; the cells expressing both neuronal and mesenchymal genes are represented in purple. (B) UMAP expression pattern of individual ECM genes belonging to the VT blue mesenchymal subset. (C) Information-based network. Left panel: miic plot of the 89 central core genes of the VT blue module. Right panel: UMAP expression patterns for Ddc (encircled on the miic plot) and of three of its connected genes. (D) Analysis of protein-protein interactions using STRING. Direct STRING interactions are indicated by continuous thick black lines and indirect ones by dashed thick black lines. The thin purple lines represent the remaining miic interactions not found using STRING. The table indicates the STRING interactions and the intermediate nodes if any. |