
Fig. 2
- ID
- ZDB-FIG-240515-8
- Publication
- Miladinovic et al., 2024 - A multistep computational approach reveals a neuro-mesenchymal cell population in the embryonic hematopoietic stem cell niche
- Other Figures
- All Figure Page
- Back to All Figure Page
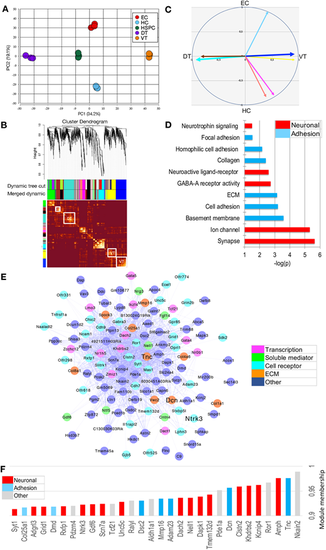
Correlation-based network analysis of mesenchyme-enriched genes discloses three major modules, one ventrally and two dorsally located. (A) PCA (using 2401 genes and 15 samples) highlighting the different clusters. The score plot of PC1 versus PC2 is shown. (B) Module detection using WGCNA. Modules named by colors correspond to squares along the diagonal of the topological overlap matrix plot shown below the clustering tree. Modules are defined in a first step according to the dynamic tree cut method, and in a second step according to the merged dynamic one. DT and VT modules are highlighted. (C) Module eigenvectors corresponding to the DT to VT (PC1 trait) and to the EC to HC (PC2 trait) contrasts. The vectors corresponding to the major DT and VT modules (‘turquoise’ and ‘blue’, respectively) are in thicker lines. (D) Significant GO categories corresponding to genes belonging to the major VT blue module. (E) Connectivity plot of the 119 most connected genes (out of a total of 295) belonging to the VT blue module. (F) Connectivity bar plot of the top-30 genes of the VT blue module |